SDR Metrics: Call the Roll From the List, Then Read the Activity
Most SDR metrics start from the activity log, and a lead no rep touched never appears in an activity log.
The leading and lagging SDR KPIs, the difference between worked and logged, and the six numbers that show whether reps work the leads they prospect.
SDR metrics are the numbers a sales leader uses to judge a sales development team: leading metrics that show whether the work is being done to the team's standard, and lagging metrics that show what the work produced in meetings, pipeline and revenue.
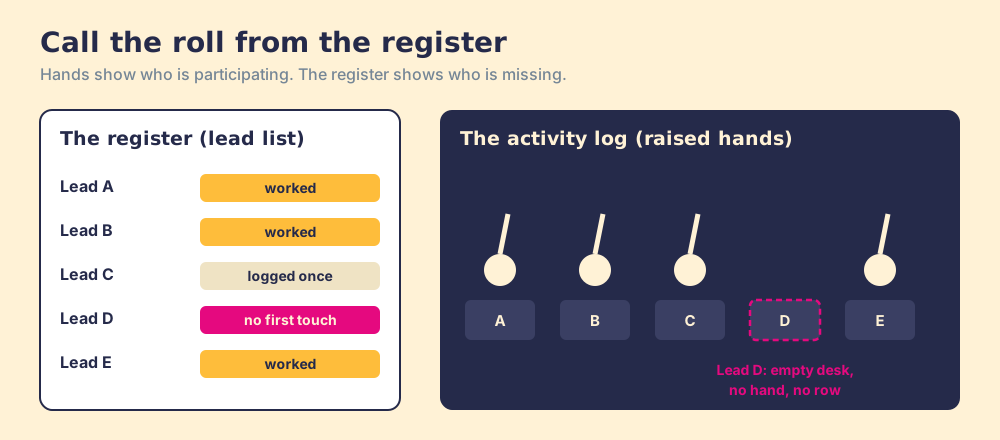
A teacher who wants to know who came to class does not count the hands in the air. She opens the register and calls the roll, name by name, from the list of students enrolled. The hands tell her who is participating. The register tells her who is missing, and a student who stayed home will never raise a hand to say so.
SDR metrics are usually built from the hands. A dashboard counts calls, emails, sequences, meetings, and all of it is real, but a lead a rep sourced and then never touched creates no call, no email and no row. It cannot appear on a report built from activity, no matter how good the report is. The question a sales leader is asking, whether reps work the leads they prospect, can only be answered from the register: the list of leads, each with a status.
What are SDR metrics?
SDR metrics are the numbers a sales leader uses to judge a sales development team: leading metrics that show whether the work is being done to the team’s standard, and lagging metrics that show what the work produced in meetings, pipeline and revenue. Most lists of SDR KPIs mix the two. Artisan’s eight SDR metrics (Jaspar Carmichael-Jack, April 2025) is a fair example of the genre: dials and connects, emails sent, email response rate, lead-to-opportunity conversion, meetings booked, qualification rate, follow-up time, revenue. Each item is reasonable, and all eight are counted from events, which means none of them can show the lead that never got an event.
Which SDR KPIs are leading and which are lagging?
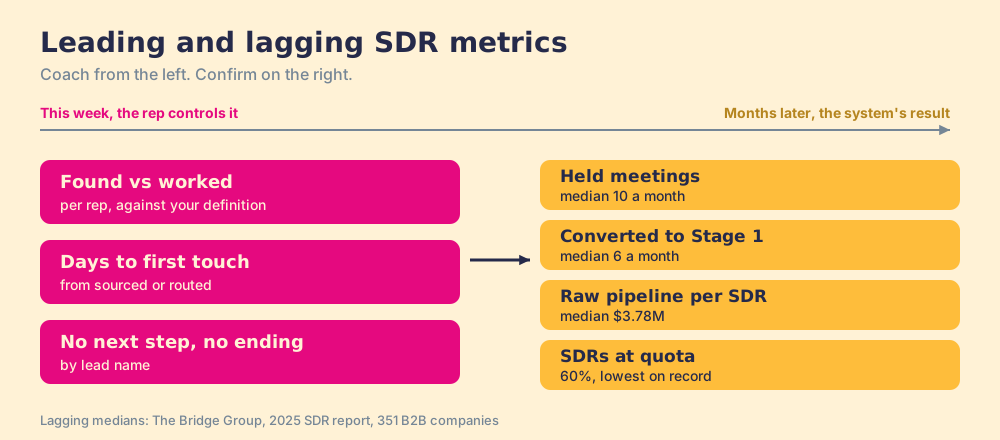
Sort them by when they move and who controls them. A leading metric moves this week and the rep controls it. A lagging metric moves months later and sums up many people’s work.
| Metric | Type | What it tells you | Benchmark or source |
|---|---|---|---|
| Activities per day | Leading | Effort, by channel | Bridge Group 2025 median 112 (44 phone, 41 email, 19 LinkedIn, 8 other) |
| Quality conversations per day | Leading | Effort that reached a person | Bridge Group 2025 median 4.1 |
| Found vs worked, per rep | Leading | Whether sourced leads got the full play | Your definition; no public benchmark |
| Days to first touch | Leading | Whether leads are picked up or left | HBR 2011: within the hour, nearly 7x as likely to qualify |
| Leads with no next step or ending | Leading | Leads stalled in a rep’s name | Ebsta and Pavilion 2024, opportunities: top performers 412% more likely to have a next step |
| Held meetings per month | Lagging | Output of the top of funnel | Bridge Group 2025 median 10 |
| Meetings converted to Stage 1 | Lagging | Handoff quality | Bridge Group 2025 median 6 |
| Pipeline sourced | Lagging | Value created | Bridge Group 2025 median $3.78M per SDR, raw |
| Quota attainment | Lagging | The whole system | Bridge Group 2025: 60% of SDRs at quota |
The Bridge Group’s 2025 SDR report, from 351 B2B companies, shows why the lagging rows cannot steer a team on their own. Median activity sits at 112 a day, pipeline per SDR rose to $3.78M, and yet 60 percent of SDRs hit quota, “the lowest reported in study history,” with held meetings down 40 percent since 2018. The report labels its own pipeline number plainly: “Pipeline figures represent raw pipeline generated, not forecast or closed-won revenue.” The effort and the raw pipeline both went up while the share of reps reaching quota went down. The lagging numbers report the miss after it happens. The leading numbers in the middle three rows are where a manager can still change it.
How can a sales leader see whether reps actually work the leads they prospect?
Call the roll from the list. Build the view from the leads each rep sourced or was assigned in a window, and give each lead one status, so the manager reads a register and the activity count sits beside it as context. Three counts per rep, then three named exception lists.
The counts use three plain labels, found, worked and closed:
- Found. Leads the rep sourced or was routed in the window, with source and tier tagged at creation.
- Worked. Of those, the leads that met your written definition of worked. The definition is yours, because the motion is yours: one person reached and one meeting held in a small-business motion, two people across two functions in mid-market, the buying group mapped in enterprise, where Gartner puts the typical group at 6 to 10 people.
- Closed. Of those, the leads that reached an ending: Qualified (handed to an AE and accepted), Recycled (back to marketing or a nurture tier with a return date), or Disqualified (with the reason). Closed here means the lead has an ending, which is a different question from whether a deal closed.
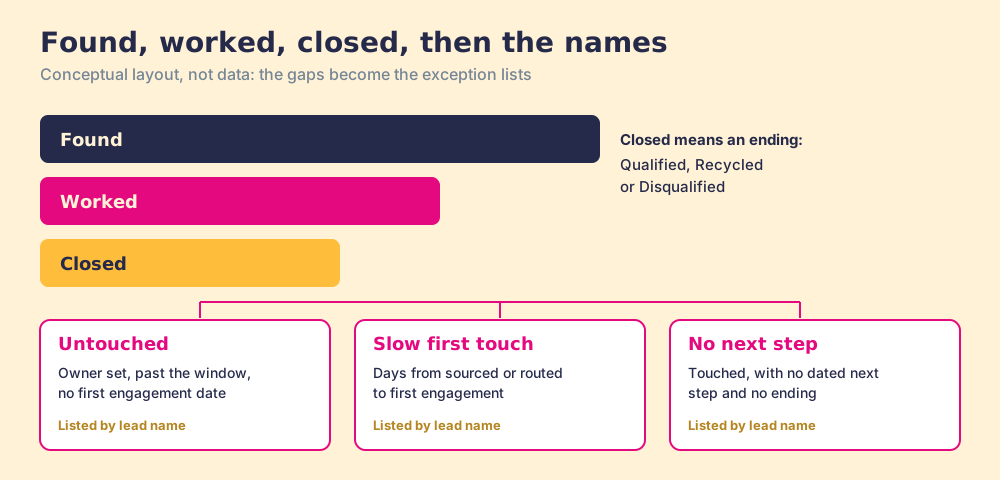
Then the exceptions, by lead name, because a count tells the manager there is a problem and a name tells them what to coach:
- Untouched leads. Owner set, sourced or routed date older than your window, no first engagement. HubSpot already keeps the field for this: its default “Date of first engagement” property records “the date the current contact owner first engaged with the contact,” and “Lead response time” is “automatically set by HubSpot” (HubSpot default contact properties). A lead with an owner and a blank first-engagement date is the empty desk.
- Slow first touches. Days from sourced or routed to first engagement, per rep and per tier.
- No next step, no ending. Leads touched at least once with neither a dated next action nor an ending.
The reason this works is older than sales software. In Karau and Williams’s meta-analysis of 78 studies on social loafing, effort held up in groups when two conditions were met: “the participant’s output must be known or identifiable,” and “there must be a standard (personal, social, or objective) with which this output can be compared” (Karau and Williams, 1993). A team-level activity total meets neither condition. A per-rep register against a written definition of worked meets both.
What is the difference between a lead that was worked and one that was logged?
A logged lead has an activity row. A worked lead met the definition. The gap between them is the gap between enrolling a contact in a sequence and finishing the play.
HubSpot’s own fields show how wide the gap can be. Its “Last contacted” property updates on the last logged chat, call, one-to-one email, meeting, or manual LinkedIn, SMS or WhatsApp message. A single logged email sets it. So a lead can carry a fresh “Last contacted” date and still have had one touch on one channel, with the second channel never started and no call ever made. The CRM is telling the truth about what it recorded. It has no way to know your definition unless you write it down as a rule.
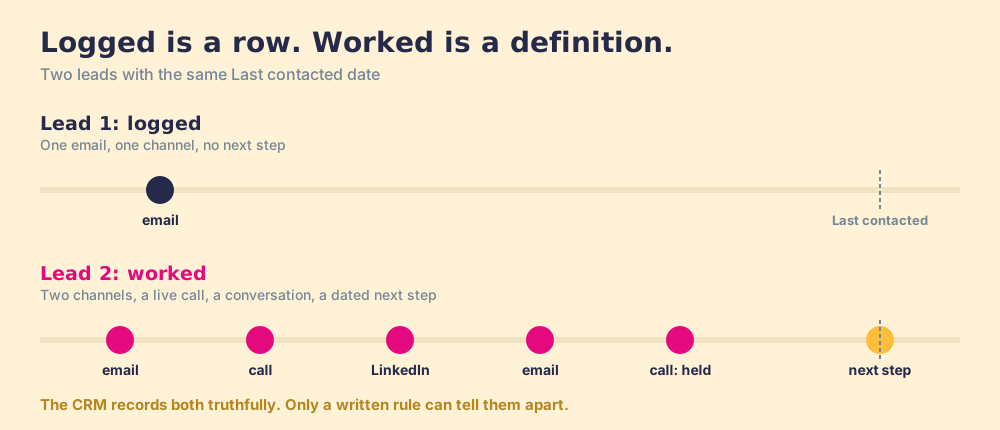
Write worked as a checkable rule, for example: at least six touches across at least two channels, including one live call attempt, inside fourteen business days, and the lead then has a dated next step or an ending. The numbers in that example are placeholders for yours; the sales cadence post has the research for choosing them. Once the definition is a rule, worked becomes a count the system can produce, and logged stops masquerading as it.
None of this makes activity metrics wrong. Counting calls and emails is how a manager verifies the play is being run, and the touches are the buyer’s whole experience of your team. The sales activity metrics debate lands in the same place: keep the counts, read them beside the list, and never let a lead advance on activity alone.
How do you measure time to first touch and untouched leads?
From the timestamp the lead entered a rep’s name to the first real touch, per rep. Inbound and sourced leads need different windows, and the inbound evidence is the strongest in the field.
When Harvard Business Review audited 2,241 US companies, 37 percent responded to an inbound lead within an hour, 23 percent never responded at all, and firms that responded within an hour were nearly seven times as likely to qualify the lead as firms that waited one hour longer (Oldroyd, McElheran and Elkington, HBR 2011). Twelve years later Conversica tested 100 mid-market and enterprise companies and found “one in four companies tested did not respond to inbound leads at all” (Conversica via Business Wire, 2023). The HBR authors named the causes, and none of them was lazy reps: leads pulled from the CRM daily instead of continuously, sales teams focused on their own leads, and distribution rules built on geography and fairness. The speed to lead post covers the routing side in full.
For leads an SDR sources we found no comparable study, so set the window yourself in business days and measure against it. Three numbers, per rep, every week:
- Median days to first touch. For sourced and for routed leads, separately.
- Untouched count. Leads past the window with a blank first-engagement date.
- Oldest untouched lead. One name, with its age, so the number has a face.
Why do leads with no next step matter?
Because a lead with neither a next step nor an ending is the lead most likely to die without anyone deciding it should. The closest large dataset is on opportunities rather than leads, and it is stark. Ebsta and Pavilion’s 2024 benchmarks, drawn from 4.2 million opportunities at 530 companies, found top performers “412% more likely to have next step or meeting defined,” and that “more than 7 days of inactivity (with no future activity) reduces win rates by 65%” (Ebsta and Pavilion, 2024). Leads are earlier and cheaper than opportunities, so the effect size will differ, but the mechanism is the same: a record with no future activity has no owner of its future.
The rule that follows is simple to state. A touched lead holds one of two things at all times: a dated next step, or an ending. Anything else goes on the exception list.
Why don’t generic CRM dashboards answer the question?
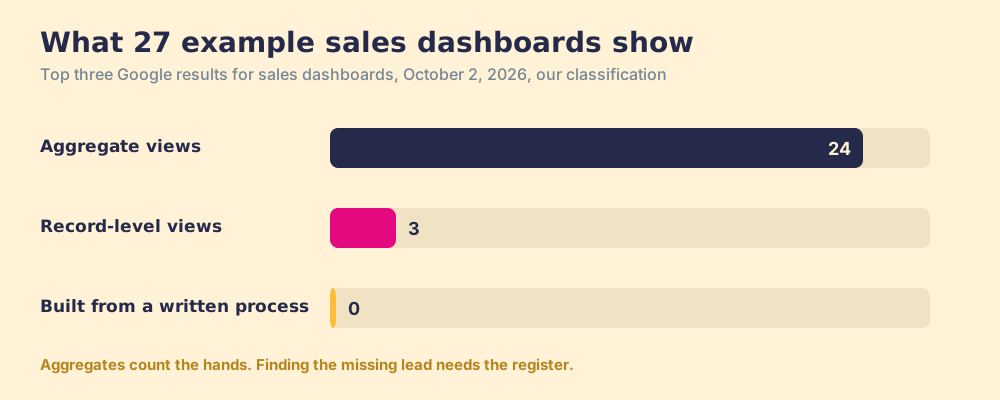
They are built to summarize, and summarizing is the wrong tool for finding the missing name. When we classified the 27 example dashboards on the top three Google results for “sales dashboards” on October 2, 2026 (our classification, detailed in the sales dashboards post), 24 showed aggregates, 3 showed individual records, and none was built from a written process listing the records that broke an agreed step. Gartner’s survey of 303 sales leaders found 84 percent agreed sales analytics had less influence on sales performance than expected (Gartner, 2024).
Some tools get partway there. Salesforce Pipeline Inspection shows a red clock when an opportunity’s Next Step has not been updated in a week or more (Salesforce Ben, updated May 2026). That is a register for opportunities. The SDR’s leads sit upstream of it, and the definition of worked has to come from you.
The weekly SDR metrics review
Thirty minutes a week, counted by the system beforehand. The agenda follows the register:
- Found, worked, closed per rep. Read the gaps, then pick one rep’s gap to coach.
- Untouched and slow first touches. By name. Ask what in the system made them hard to reach: a bad list, a routing rule, a day eaten by inbound.
- No next step, no ending. By name. Each one leaves the meeting with a date or an ending.
- Meetings accepted and returned. With the AE’s reasons, read as coaching material for both seats.
- One lagging check. Meetings and Stage 1 conversions against last month, to confirm the coaching moved something.
The case for doing it weekly and by rule is in our own data: in The State of Sales Enablement, teams that inspect deals against a defined process at the highest frequency hit quota at 6.3x the rate of the lowest band. The trap is the hours. A manager counting found, worked and closed by hand for eight reps gives up by the third week, and the review shrinks to a gut feel and the top five accounts. Inspection is mandatory. Doing the counting by hand is optional, and it is what kills the habit.
What we recommend
Three ways to answer the question are open to a sales leader. Read the activity dashboard: cheap, already built, and blind to the lead no one touched. Build the register by hand in a spreadsheet each week: accurate for a month, then abandoned when the hours run out. Write worked, next step and ending as rules the CRM checks lead by lead, and read the exceptions weekly.
We recommend the rules. Karau and Williams say effort holds when output is identifiable against a standard, HubSpot already stores the first-engagement and last-contacted dates you need, HBR and Conversica say the lead most often lost is the one never touched, and Ebsta and Pavilion say records with no next step lose. The rules turn all of that into a register that fills itself.
Supered does that job. Supered’s Process Rules describe the bad state (“Process rules fire when their conditions are TRUE”), run on HubSpot objects including leads, compare dates in days, and roll up into Process Boards that send daily or weekly summaries to the manager, a Slack channel or email. A lead that has an owner, was created more than 2 days ago and has no first engagement date can be written as a rule; so can a touched lead with no next step and no ending. The rule is the written definition and the board is the register, and sales expectations shows how a team writes its own. Supered runs in HubSpot, Salesforce and Pipedrive.
For teams that source leads on Clay, Supered Prospector puts the same register on the prospect list itself. Reps run your Clay tables from LinkedIn, Sales Navigator, a company website or the CRM record, see whether the lead is already owned or was worked before, and push to the CRM in one click. The manager sees each list found, worked and closed, with every lead ending the way your process says: Qualified, Recycled or Disqualified. Prospector works within LinkedIn’s terms and does not copy search results in bulk; the contact data comes from Clay’s waterfall on the customer’s Clay account. It runs inside the Supered Chrome extension at $45 per rep per month billed annually, on your own Clay account. Prospector for sales leaders shows the manager’s view.
The plays these metrics inspect are in the SDR playbook, with a one-page template. For the stage-by-stage version of the same idea, read the sales prospecting process, and for the role itself, what an SDR is.
Frequently asked questions
How can a sales leader see whether reps actually work the leads they prospect?+
What are the most important SDR metrics?+
What is the difference between leading and lagging SDR KPIs?+
What is a good time to first touch for an SDR?+
Why do activity dashboards miss untouched leads?+
Are SDR activity metrics a bad idea?+
Your Clay waterfall, where reps already work.