Sales Conversion Rates: Your Benchmark Measures the Gate Before the Buyer
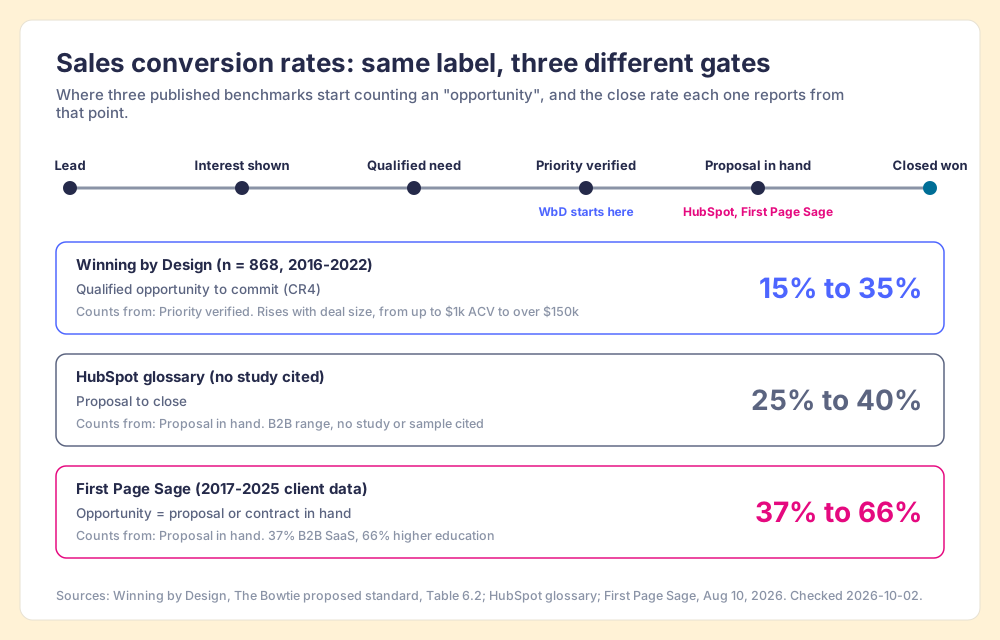
Three published benchmarks put the opportunity-to-close rate anywhere from 15% to 66%, because each one starts counting at a different gate.
The formula, real benchmarks by stage, how the rates compound, and a diagnosis that starts with the gate.
A sales conversion rate is the percentage of leads or deals that move from one stage of your sales process to the next, or all the way to closed won, calculated as the number that reached the later stage divided by the number that entered the earlier one, times 100.
Three respected sources will tell you what share of opportunities close. Winning by Design says 15% to 35%, depending on deal size. HubSpot says 25% to 40%. First Page Sage says 37% for B2B SaaS and up to 66% in other industries. A sales leader who reads all three in one sitting comes away with a range wide enough to justify any number on the board, which is roughly how a weather forecast of “between sleet and sunburn” feels.
A sales conversion rate is the percentage of leads or deals that move from one stage of your sales process to the next, or all the way to closed won, calculated as the number that reached the later stage divided by the number that entered the earlier one, times 100. The sources above do not disagree about buyers. They disagree about where the word “opportunity” starts. First Page Sage counts a deal as an opportunity once a proposal or contract is in hand. Winning by Design counts it once the buyer has verified the problem is a priority. Same label, two different gates, so a stage conversion rate always measures two things at once: how buyers move, and where your team hangs the gate. If your reps hang it in different places, your rate is mostly a report on their habits.
What is a sales conversion rate, and what is the formula?
The sales conversion rate formula is one division. Take the number of leads or deals that reached a stage, divide by the number that entered the stage before it, and multiply by 100. Salesforce’s own explainer uses the simplest version: 100 leads and 27 closed deals is a 27% sales conversion rate (Salesforce).
The trouble starts with the two words in the denominator, “entered” and “stage.” Three choices decide whether the number means anything:
- Cohort over calendar. Count the deals that entered a stage in a given month and follow those same deals until they move or die. A calendar count (deals won this month divided by opportunities created this month) mixes deals from different months, so a big month of new pipeline makes the rate look worse for reasons that have nothing to do with selling.
- Closed deals only. For a win rate, divide closed won by closed won plus closed lost. Deals still open are not losses yet, and counting them drags the rate down whenever pipeline grows.
- One written gate per stage. The denominator is only as good as the rule that let deals into it. If one rep creates an opportunity after a first call and another waits for a confirmed budget, the stage contains two different kinds of deal.
Winning by Design’s proposed standard for revenue data makes the same point with an engineer’s definition: each stage is a system with an input and an output, and “dividing the output by the input provides a conversion metric” (Winning by Design, The Bowtie proposed standard). The win rate, in their words, “is the number of commits divided by the total number of qualified opportunities.” The division is easy. The definition of “qualified” is the work.
What is a good sales conversion rate?
A good sales conversion rate is one measured against a benchmark whose stages start where yours do. With that warning on the label, these are the B2B sales conversion rates worth knowing, each checked against its source on 2026-10-02.
| Source | Sample | Stage | Rate |
|---|---|---|---|
| First Page Sage, 2026 report | Client and internal data, 2017 to 2025 | Lead to MQL (B2B SaaS) | 39% |
| First Page Sage | Same | MQL to SQL (B2B SaaS) | 38% |
| First Page Sage | Same | SQL to opportunity (B2B SaaS) | 42% |
| First Page Sage | Same | Opportunity (proposal in hand) to closed won | 37% B2B SaaS; 66% higher education |
| Winning by Design | 868 companies, 2016 to 2022 | Qualified opportunity to commit (CR4) | 15% (deals up to $1k ACV) to 35% (over $150k) |
| HubSpot glossary | No study or sample cited | Proposal to close | 25% to 40% |
| HubSpot glossary | Same | B2B lead to customer | 2% to 5% |
Sources: First Page Sage, Sales Funnel Conversion Rate Benchmarks (updated Aug 10, 2026); Winning by Design, Table 6.2; HubSpot glossary.
First Page Sage is the most useful of the three because it prints its definitions. An MQL is a lead that has “expressed a clear buying interest and can afford the product or service,” an SQL has received pricing and wants to continue, and an opportunity “has a proposal or contract in hand.” That last definition explains why its close rates run high. By the time First Page Sage calls something an opportunity, a lot of selling has already happened.
Winning by Design sets its gate earlier, at a buyer who has “verified that this is a priority and no action carries a consequence.” Its rates also climb with deal size, from 15% for deals up to $1,000 a year to 35% above $150,000, which matches the intuition that a big purchase rarely reaches a qualified stage by accident.
Why do sales conversion rate benchmarks disagree?
Because a conversion rate is a clearance rate, and each team sets its own bar.
Suppose two high jumpers report their results. One clears 60% of attempts and the other 25%. The first sounds better until you learn she set her own bar at the height of a park bench, and the second set his at the height of a door. The clearance rate tells you where the bar sat before it tells you who jumps better. A sales team that opens an opportunity when a demo is booked will report a lower win rate than a team that waits for a decision maker, a budget and a date, even if both sell to the same buyers with the same skill.
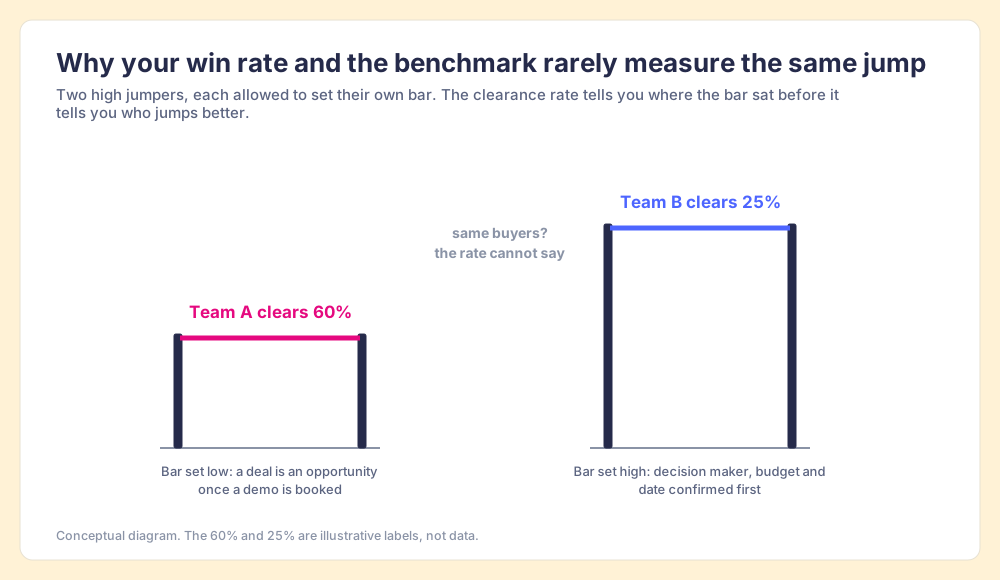
Winning by Design says this plainly about its own field. Historically, “industry benchmarks lack a standardized Data Model; e.g. the data was not normalized.” On comparing yourself with peers: “Usually, this comparison is not useful, as it is unlikely that the company’s data are aligned with their model.” Its recommendation is self-benchmarking on your own trend line over the last twelve months.
The high-jump comparison stops working at one point, and the point matters. A high jumper sets the bar once per attempt, in public. A sales team sets it hundreds of times a month, one rep and one deal at a time, mostly unseen. So the bar is rarely in one place even inside a single team. In The State of Sales Enablement 2026, 89% of teams had a defined sales process and 36% saw reps follow it, a 53-point gap (The State of Sales Enablement). If two thirds of teams watch the process get skipped, the stage gates get skipped with it, and the conversion rate between stages is averaging several different bars.
None of this is a rep problem. Reps move deals the way the system lets them. If the CRM lets a deal into Proposal with no decision maker named, some reps will put it there, and the rate will report the result as buyer behavior.
How do stage conversion rates compound?
Stage rates multiply, which is why small gate problems turn into large revenue problems.
A sales funnel works like a bucket brigade. Water passes from hand to hand, and each pour spills some. The amount that reaches the fire is the product of every pour, so spilling a little less at each hand fills the last bucket by a lot more than any single hand could. Run First Page Sage’s B2B SaaS rates through four hand-offs and 39% times 38% times 42% times 37% leaves about 2.3% of leads as customers. Make each hand-off 10% better (39% to 42.9%, and so on) and the chain delivers about 3.4%. Four modest improvements produce about 46% more closed deals from the same leads, because 1.1 multiplied by itself four times is 1.46.
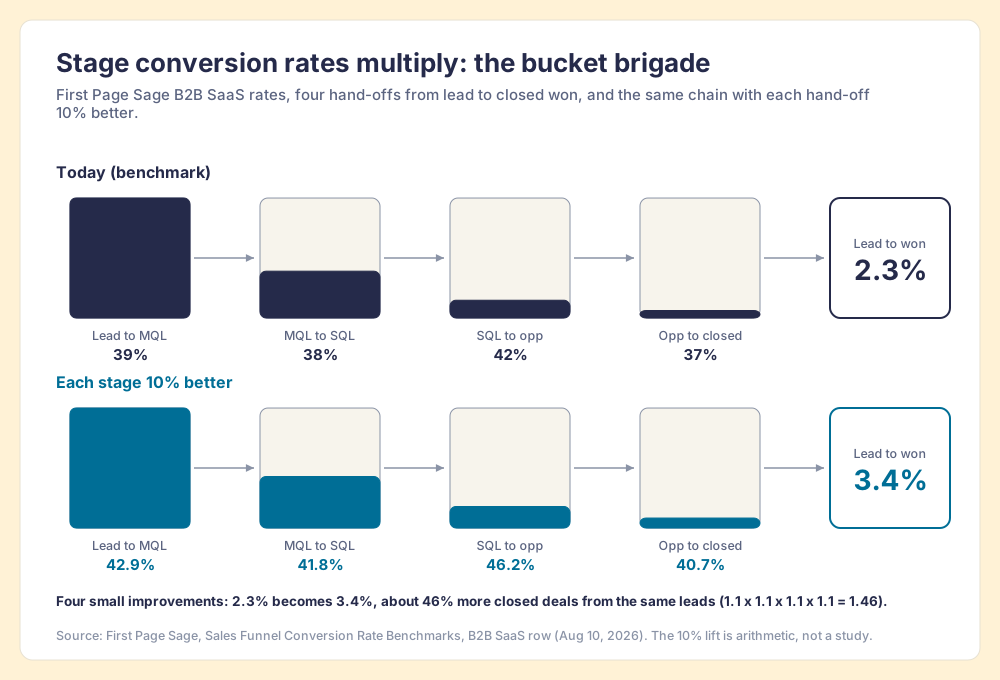
The multiplication runs backward too, and Winning by Design shows what it costs. In a client example from its standard, an SMB win rate that averaged about 30% drifted down to 26%. At 30%, a seller needs 1 / 0.3 = 3.33 opportunities per win; at 25%, they need 4.0, which is 20% more pipeline for the same number. The same client saw opportunity counts rise as win rates fell, across all three of its sales motions. More opportunities at a lower win rate is often the signature of a gate that moved, not a market that changed.
How do you diagnose a low sales conversion rate, stage by stage?
Ask two questions at every hand-off, in this order. First: did the deals in this stage get here by the same gate? Second, only once the first answer is yes: what is stopping buyers from moving on? The first question is about your process. The second is about your selling. Answering the second while the first is still open sends you coaching reps on a number that measures stage hygiene.
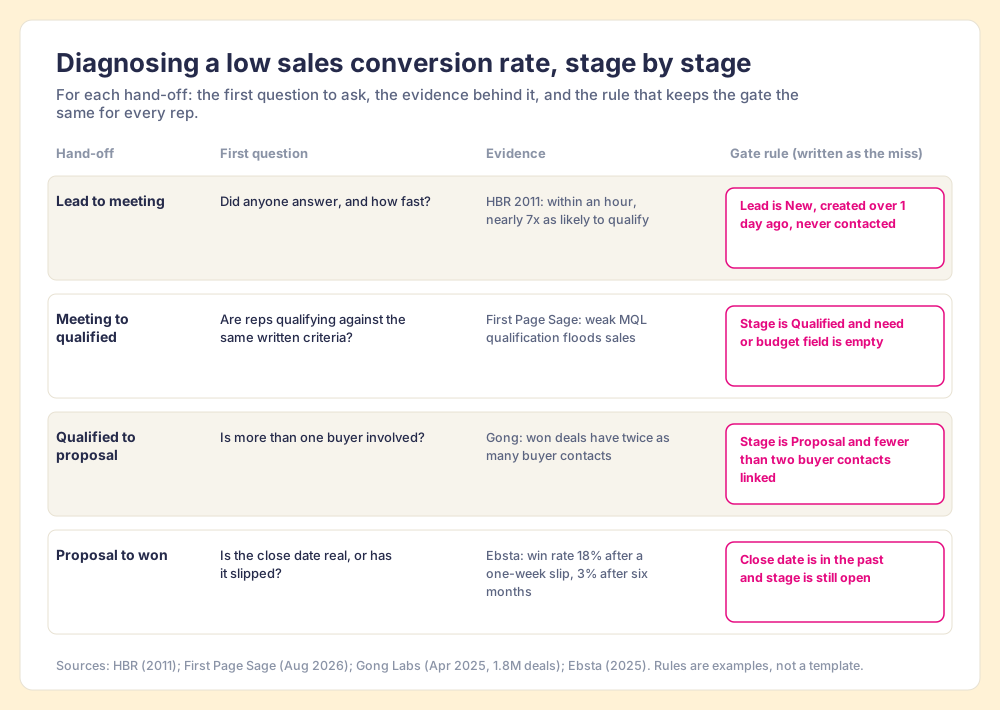
- Lead to first meeting. The first suspect is response time. HBR’s audit of 2,241 US companies found that firms contacting a lead within an hour were nearly seven times as likely to qualify it as firms that waited an hour longer (HBR, The Short Life of Online Sales Leads, 2011). A low rate here is often a routing and follow-up problem, covered in depth in our post on speed to lead.
- Meeting to qualified. The suspect is the qualification standard itself. First Page Sage names “poor MQL qualification process” as the reason sales gets “inundated with low-quality leads.” If reps qualify by feel, two reps with the same buyer will disagree, and the rate tells you how often. Shared criteria, written as fields, are the fix; our guide to lead qualification walks through the frameworks.
- Qualified to proposal. The suspect is a single thread. Gong’s analysis of 1.8 million deals closed in 2024 found won deals had twice as many buyer contacts as lost ones, and that multi-threading lifted win rates by an average of 130% in deals over $50,000 (Gong Labs, April 2025). A proposal sent to one champion is a proposal that has to be resold internally without you.
- Proposal to closed won. The suspect is the close date. Ebsta’s 2025 GTM Benchmarks digest, built on 655,000 opportunities worth $48 billion, charts win rate against how long a deal slipped: 18% after a one-week slip, 13% after a month, 8% after three months, 5% after six, and 3% beyond that (Ebsta, 2025 GTM Digest: Sales Efficiency). A slipped deal is like bread past its date. It is not always bad, but every week on the shelf makes it less likely anyone takes it home.
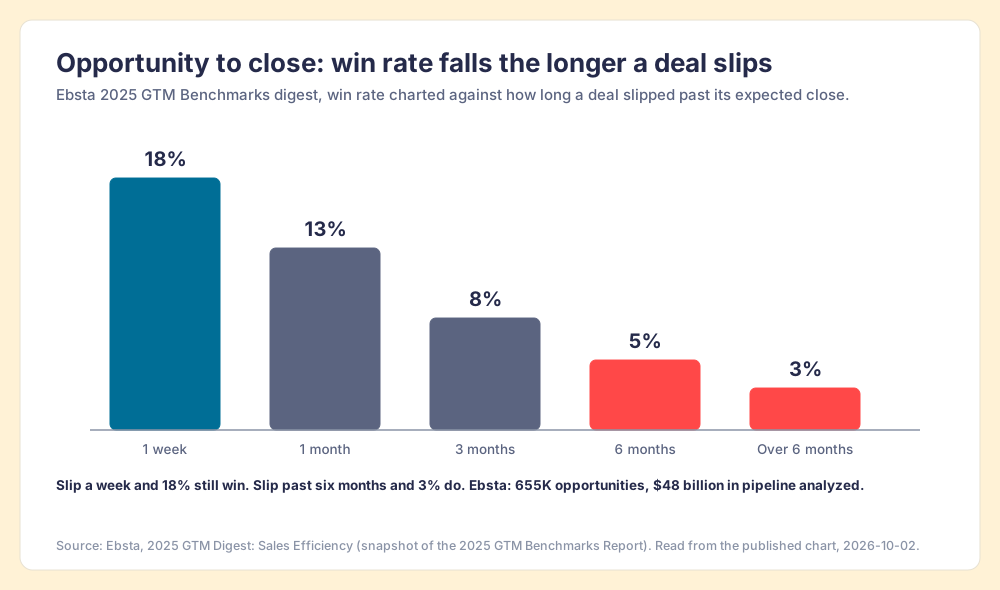
Ebsta also found that top performers were 24% more likely to disqualify non-ICP deals early. That finding cuts against a common instinct. Disqualifying early lowers the number of opportunities and raises the win rate, and both moves are good, because the deals that would have slipped for six months never entered the stage.
How do you improve sales conversion rates?
Fix the gate first, then the selling. In practice that means five things, in this order:
- Exit criteria as fields. Write down what must be true before a deal leaves each stage (a named decision maker, a confirmed budget range, a real next meeting) and make each one a CRM field, not a line in a playbook. A field can be checked. A paragraph cannot. Our breakdown of sales pipeline stages has examples.
- A daily check against the criteria. Run every open deal against the criteria each day and show the misses to the rep while the deal is still moving. Teams that inspect deals against a defined process at the highest frequency hit quota at 6.3x the rate of the lowest band (The State of Sales Enablement).
- Cohort reporting by stage. Report each hand-off by the cohort that entered it, so a big month of new pipeline does not pass for a collapse in selling.
- Your own trend line first. Compare this cohort to your last twelve months before you compare to any benchmark. Use the benchmark only after you have matched its stage definitions to yours.
- One stage at a time. Pick the hand-off with the biggest gap to your own trend and work its first question from the diagnosis above. Because the rates multiply, a ten percent gain anywhere moves the final number.
None of this is glamorous. It is closer to plumbing, and like plumbing it pays off mostly in leaks that stop. The payoff reaches the buyer too: a deal that cannot enter Proposal without a second contact and a real date is a deal where the buyer gets a proposal their team is ready to read.
Where does Supered fit, and where does it not?
Supered keeps the gate in one place for every rep. You write each exit criterion as a Process Rule that describes the miss, the way Supered’s help center tells you to build rules: for example, stage is Proposal and the decision maker field is empty, or the close date is in the past and the deal is still open (Supered help center, Process Rules logic). The rules run against your deals in HubSpot, Salesforce or Pipedrive. Deals that break a rule land on a Process Board that reps open inside the CRM, and managers can get a daily or weekly summary by email or in Slack. If a rep works in Claude, Claude reads the same rules and can fix what the CRM context supports, such as filling the amount from discovery notes or drafting the recap email for review. On my own deals, one prompt cleared 11 violations against 22 rules in about 10 minutes, against about 45 by hand. One example from my own pipeline, not an average.
The effect on your conversion rates is indirect, and it is the effect you want: the denominator becomes deals that met the gate, so the rate starts measuring buyers.
Choose something else if your problem is the reporting itself. HubSpot, Salesforce and Pipedrive all report stage-to-stage conversion from deal stage history, and a BI tool or a revenue intelligence platform will slice it by cohort, segment and rep better than Supered will. Supered does not draw funnel charts. It keeps each stage meaning the same thing underneath them.
Process Compliance, which includes Process Rules and Process Boards, is $40 per user per month paid yearly ($45 monthly), with a five-user minimum (Supered pricing). Supered started inside RevPartners, the HubSpot partner I founded, and it is rated 4.9 on G2 from 81 reviews (checked 2026-10-02). The sales expectations use case shows the board, the sales process adoption page covers the wider rollout, and you can book a demo to see your own stage gates running.
The recommendation
You have three ways to go after a low conversion rate. Buy a benchmark and chase it. Coach the stage that looks worst. Or write the gate for each stage, check it daily, and only then decide which stage to coach.
I would do the third. The benchmarks disagree by more than four times on the same label because the gates differ, and Winning by Design, whose benchmark is the most careful of the three, tells you not to lean on peer comparisons for that reason. The stage rates multiply, so a gate that drifts at one hand-off spreads through the whole chain. And the evidence on what moves buyers (response time, more contacts, real close dates) is only usable once the stage means the same thing for every rep. Hold the gate, then read the number. When you are ready to turn stage rates into a speed measure, our post on sales velocity picks up from here, and pipeline hygiene covers keeping the stages current once the gates are in place.
Frequently asked questions
What is a good sales conversion rate?+
What is the sales conversion rate formula?+
What is the average B2B sales conversion rate from lead to customer?+
Why do sales conversion rate benchmarks disagree so much?+
How do you improve sales conversion rates?+
Can HubSpot, Salesforce or Pipedrive track stage conversion rates?+
Your process, running itself.