Sales Velocity: Why a Dirty Pipeline Doubles the Number
The sales velocity formula is sound.
All four inputs come from the CRM, and dead deals left open inflate two of them and shorten a third. A worked example, the slip evidence, and the stage rules that keep each input true.
Sales velocity is the revenue your pipeline produces per day, calculated as open opportunities times average deal size times win rate, divided by the length of your sales cycle in days.
Sales velocity is the revenue your pipeline produces per day, calculated as open opportunities times average deal size times win rate, divided by the length of your sales cycle in days. The formula is sound. The trouble lives in the four numbers you feed it, because all four come straight out of the CRM, and a CRM carrying deals that died weeks ago will hand you a figure that flatters the business it describes. In the worked example below, a pipeline where one deal in three is dead reports exactly twice its true sales velocity, and the reps never typed a false number.
A car stuck on an icy driveway shows the problem better than any chart. The driver presses the pedal, the wheels spin, and the speedometer, which counts wheel turns, climbs to 60. The car has not moved a foot. A GPS, which watches the road, reads zero. The speedometer is working perfectly. It measures the wheels, and the wheels are not the road.
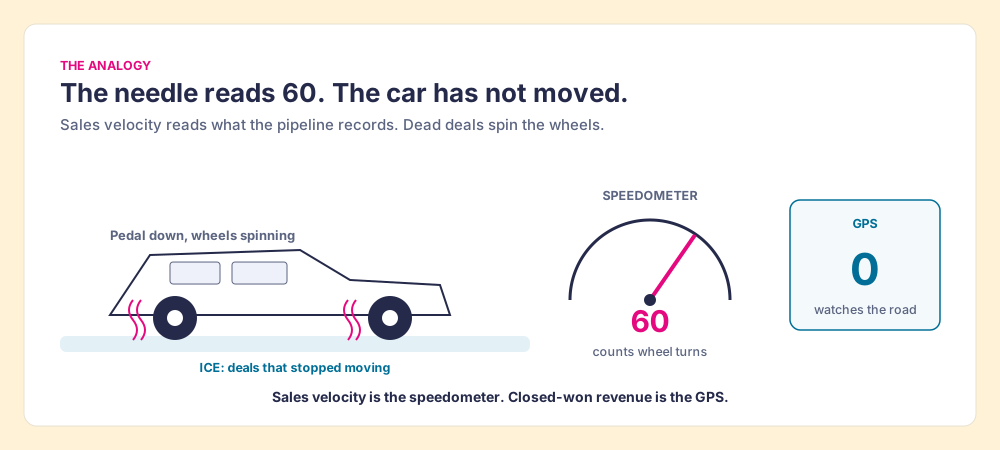
Sales velocity is a speedometer. It reads the pipeline, and when the pipeline holds deals that stopped moving, the needle climbs while the bank balance stays put.
What is sales velocity, and what does the formula measure?
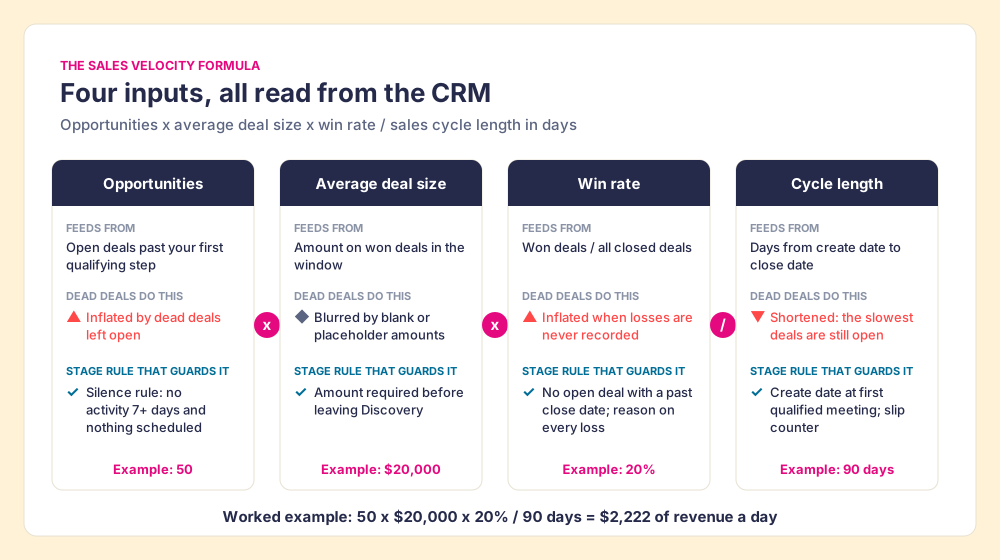
What is sales velocity in plain terms: the dollars your current pipeline should turn into per day, at the rate your team wins and the pace your deals close. The sales velocity formula multiplies three things that make revenue bigger and divides by the one that makes it slower:
Sales velocity = (opportunities x average deal size x win rate) / sales cycle length in days
The plainest way to show how to calculate sales velocity is one example team with 50 qualified opportunities open, an average won deal of $20,000, a 20% win rate and a 90-day cycle. Fifty times $20,000 is $1,000,000 of open pipeline. At a 20% win rate that pipeline should produce $200,000. Spread over 90 days, sales velocity is $2,222 a day, or about $66,700 a month.
The four inputs, defined:
- Opportunities. The count of open deals that passed your first qualifying step. Not leads, not contacts: deals someone would defend in a pipeline review.
- Average deal size. The mean amount on won deals over the same window.
- Win rate. Won deals divided by all closed deals, won plus lost.
- Sales cycle length. The average days from the deal’s create date to its close date.
Sales pipeline velocity, pipeline velocity and deal velocity are the same formula under other names. Some teams run it stage by stage to find where deals stall, and each stage inherits the same data problems.
The pages that rank for this term give you that formula and four tips: more opportunities, bigger deals, better win rate, shorter cycle. HubSpot’s guide (Meg Prater, updated May 7, 2025) adds one rule that matters more than the tips: “keep your variables and definitions consistent,” and it asks when a lead becomes a quality opportunity (HubSpot). The instinct is right, and it is aimed at the wrong end of the deal. Defining when an opportunity starts is half the job. The bigger error lives at the other end, in deals that ended and were never closed out.
Why does a dirty pipeline inflate sales velocity?
Look at where each input comes from. The opportunity count comes from open deals. Win rate and cycle length come from closed deals. A deal that dies without being marked closed-lost sits in the first group forever and never reaches the second. That one gap bends three inputs, and all three bend the same direction, upward.
- Opportunity count, inflated. The dead deal still counts as open pipeline, so the first term in the formula is too big.
- Win rate, inflated. The loss never gets recorded, so it never enters the denominator. Wins get recorded, because a win triggers an invoice and a commission.
- Cycle length, shortened. If you average days-to-close across all closed deals, the slowest deals are exactly the ones still sitting open, so the average leaves them out. If you average won deals only, a deal created on the day the proposal went out starts the clock late.
- Deal size, blurred. Open deals with blank or placeholder amounts drop out of the average or drag it, depending on how the report treats a zero. The direction varies by CRM setup; the noise does not.
Run the numbers on the example team. Over the past year it resolved 100 deals: 20 won, 80 lost. The reps marked 55 of the losses. The other 25 still sit open with close dates in the past. The report sees this:
| Input | Reported | True |
|---|---|---|
| Open opportunities | 75 (50 live + 25 dead) | 50 |
| Average deal size | $20,000 | $20,000 |
| Win rate | 26.7% (20 of 75 recorded) | 20% (20 of 100) |
| Cycle length | 90 days | 90 days |
| Sales velocity | $4,444 a day | $2,222 a day |
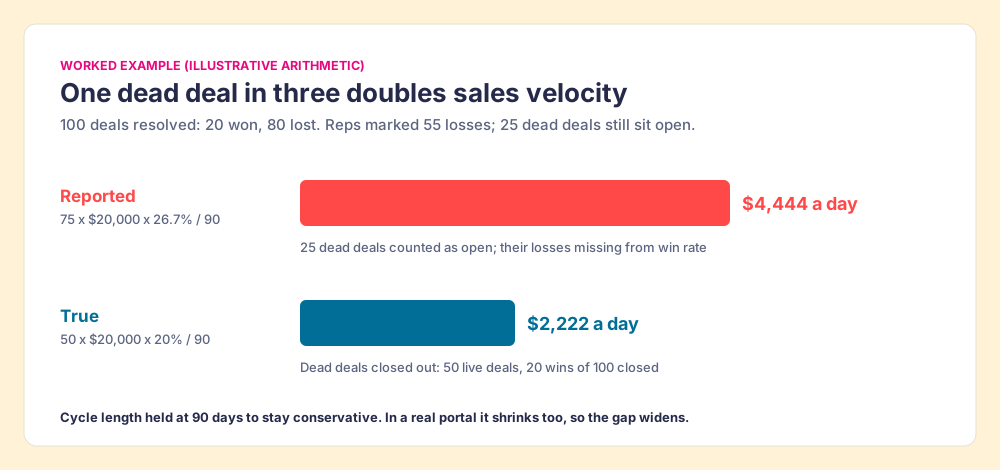
I held cycle length flat to keep the example conservative. In a real portal it would shrink too, and the gap would widen. The doubling comes from two inflated terms multiplying each other: 1.5 times the opportunities, 1.33 times the win rate.
Gong’s analysis of 13,439 B2B opportunities (Devin Reed, published 2021, updated March 6, 2026) adds the tell that finds these deals. The close dates on closed-won deals moved 31% more than those on closed-lost deals, and Gong’s explanation is plain: “Stale deals have stagnant close dates. No deal movement means no close date movement” (Gong). A moving close date is a deal someone is working. A frozen one, sliding into the past, is a deal someone stopped thinking about. The cheapest dead-deal filter in any CRM is an open deal with a close date that has already passed.
How do slipped deals change win rate and cycle length?
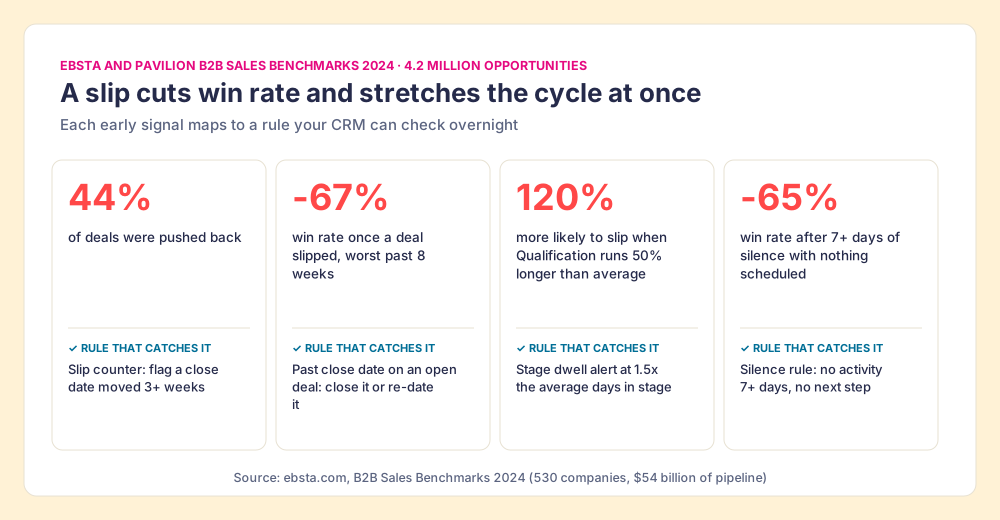
Dead deals are the extreme case. Slipped deals are the common one, and they hit two inputs at once. The Ebsta and Pavilion B2B Sales Benchmarks 2024, built on 4.2 million opportunities and $54 billion of pipeline across 530 companies, put numbers on it (Ebsta):
- Slippage share. 44% of deals were pushed back.
- Win rate after a slip. “When deals slipped, win rates plummeted by -67%, particularly for those delayed over 8 weeks.”
- Stage dwell time. If the Qualification stage runs 50% longer than average, “the deal is 120% more likely to slip.”
- Silence. More than 7 days of inactivity with no future activity scheduled cut win rates by 65%.
- Next steps. Top performers were 412% more likely to have a next step or meeting defined.
Gong draws the line at three weeks: “When sellers push the close date three weeks or more, that’s not a hiccup, it’s a hold up.”
Now feed a slip into the formula. Take one deal from the example team that slips 8 weeks. Its cycle grows from 90 days to 146. If its odds fall by Ebsta’s 67%, its contribution to velocity becomes 0.33 x 90 / 146, about a fifth of what it was. A slip never costs you one input. It cuts win rate and stretches cycle length together, so velocity falls faster than either number on its own suggests. And if the slipped deal is never closed out, it climbs back into the inflated figure above.
Which sales velocity lever should you pull first?
The arithmetic answers part of this. Because the formula multiplies, a 10% gain in opportunities, deal size or win rate each raises velocity by exactly 10%. Cutting cycle length by 10% raises it by 11.1%, because 1 / 0.9 is 1.111. On paper the four levers are close to equal, so the first lever is the cheapest one.
The catch is that the levers are tied together with string. Pull one and another moves:
- More opportunities from looser qualification. Zendesk’s guide (Donny Kelwig, updated September 22, 2025) puts it well: “You don’t need endless leads to increase your sales; you just need more opportunities” (Zendesk). Pad the count with weak deals and the win rate drops by the same mechanism that inflates it above, run in reverse.
- Bigger deals through a different channel. Ebsta found that for companies under 500 employees, outbound brought average deal values 3x those of inbound, while for companies with 500+ employees, organic inbound improved velocity 2x through higher win rates and faster cycles. Deal size and speed traded against each other by channel.
- Shorter cycles by skipping steps. A rushed stage saves days and spends win rate, which is the Qualification finding above read backwards.
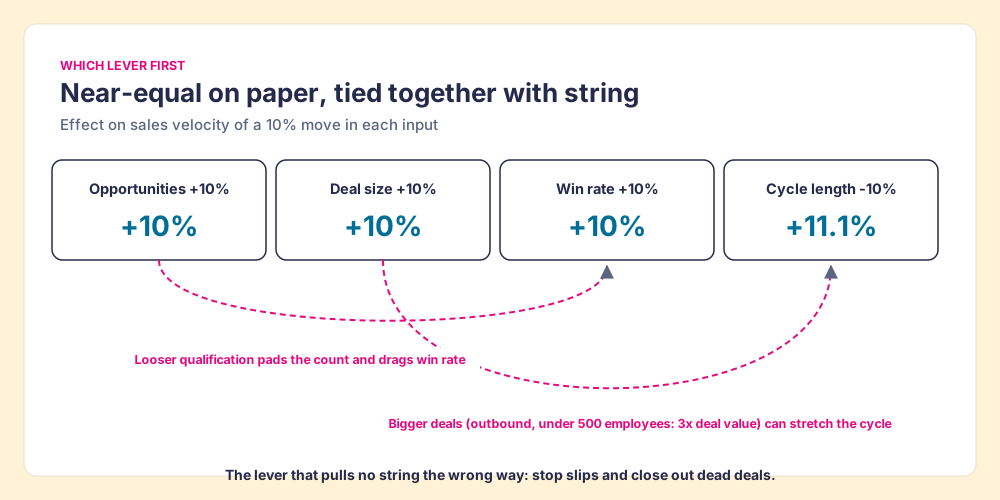
One move pulls no string the wrong way: keep deals from slipping and close out the ones that died. It lowers the reported number and raises the real one, because the rules that catch a slip protect win rate and cycle length together. It is also the only lever that makes the other three measurable.
How does stage hygiene change each input?
Stage hygiene means each stage has a written exit test and the CRM checks it, so the numbers the formula reads stay true. One rule per input, the version I would set up first:
- Opportunities: a stage-one exit test plus a silence rule. A deal enters the count when the buyer has agreed to something specific, such as a second meeting about a named problem. Any open deal with no activity for 7 days and nothing scheduled gets flagged, the exact pattern Ebsta tied to a 65% drop in win rate.
- Deal size: an amount before the deal leaves Discovery. No placeholder, no blank. A deal past Discovery without an amount is a guess the average cannot use.
- Win rate: no open deal with a past close date, and a reason on every loss. This one rule removes the 25 dead deals from the example and puts the losses back in the denominator.
- Cycle length: a create date at the first qualified meeting and a slip counter. Count how many times the close date moves three weeks or more, Gong’s hold-up line, so slips show up before they become dead deals.
Your CRM can enforce part of this natively. HubSpot pipeline rules on Professional and Enterprise can restrict skipping stages and moving deals backwards (HubSpot Knowledge Base). Pipedrive’s rotting feature turns a deal red after a stage-specific idle period, though it “disregards the next activity date, so any deal with an activity scheduled far into the future can still go rotten” (Pipedrive). Salesforce Path shows the guidance for each stage and does not enforce the fields itself (Salesforce Ben). These tools guard the gates between stages. None of them checks last night’s open deals against your whole list of expectations and tells a manager which rep owns each miss.
That gap is a measurement gap, and the evidence says it is where teams lose. In The State of Sales Enablement 2026, 89% of teams have a defined sales process and 36% see reps follow it, and teams that inspect deals against a defined process at the highest frequency hit quota at 6.3x the rate of the lowest band (The State of Sales Enablement). Reps who leave dead deals open are not careless. Closing out a deal that died brings the rep nothing in the moment, and no system asks them to. When the system asks, at the moment the rule breaks, the inputs stay clean.
Where does Supered fit in sales velocity?
RevPartners, the HubSpot partner I founded, sold roughly twice as much Sales Hub as any other partner, and Supered started inside it. Supered is where we put these rules. You write them once as Process Rules inside a Process Ruleset, rules like close date in the past, no amount past Discovery, no activity in 7 days with nothing scheduled, no decision maker named. A Process Board checks every open deal against them and lists each violation by owner. Reps fix them in HubSpot, Salesforce or Pipedrive, where the rule surfaces while they work, or ask Claude to fix them using the same rules.
My own board runs 22 rules, several of them the velocity inputs above. One night it showed 11 violations, including a past close date, a missing amount past Discovery and no decision maker. One prompt in Claude, with Supered, HubSpot and Gmail connected, cleared it in about 10 minutes; by hand it takes me about 45. Treat it as my example, not a benchmark. Process Compliance is $40 per user per month billed yearly, with a 5-user minimum (pricing). The use-case page shows the whole setup: sales expectations, followed.
Choose something else if your team has fewer than 10 sellers or works mostly from phones in the field, where Supered is not a fit, or if all you need is the velocity report itself, which your CRM’s standard deal reports already produce.
What we recommend
Fix the inputs at the source with stage rules before you trust the number, then compute it a second way as a check. The cohort view is that check: take deals created six to twelve months ago, nearly all of them resolved, and compute win rate and cycle length on that group. It removes the survivorship bias and matches HubSpot’s advice to measure over six months to a year. Computing the formula straight from the CRM is fast, and in a portal with dead deals it is wrong by a multiple.
The evidence behind that order is all above. One dead deal in three doubles the number. A slipped deal loses two-thirds of its odds. A deal silent for a week with nothing scheduled loses 65% of them. So clean the inputs, expect sales velocity to fall the first month, and plan from the lower figure. Then pull the cheapest lever, which is usually keeping live deals from slipping.
For the stage definitions behind these rules, read pipeline hygiene; for the nightly version of the same idea, CRM hygiene; and for the input that moves velocity most per day saved, the sales cycle.
Frequently asked questions
What is the sales velocity formula?+
Why did our sales velocity drop after we cleaned the pipeline?+
What is a good sales velocity?+
How do you calculate sales velocity in HubSpot, Salesforce or Pipedrive?+
Is sales pipeline velocity the same as sales velocity?+
Your process, running itself.