How to Track Sales Progress: Three Readings, and the One That Moves First
Most guides to tracking sales progress hand you 30 metrics in two buckets, results and effort.
The reading that moves first is a third one: whether the process your team agreed on happened on each open deal. Here is how to track all three, week by week.
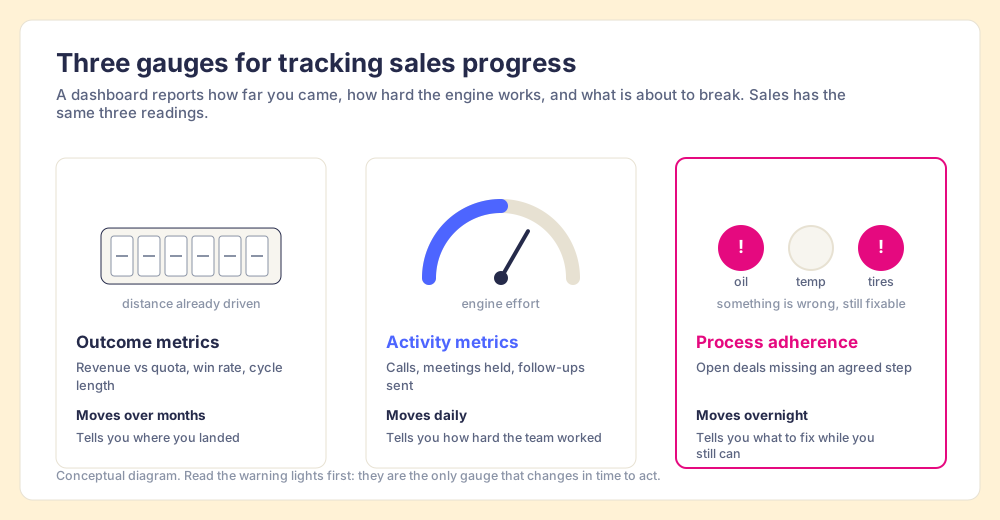
To track sales progress, measure three things on a fixed weekly cadence: outcomes (revenue, win rate, quota), activity (calls, meetings, emails) and process adherence (whether each open deal meets the steps your team agreed on), and read adherence first.
How to track sales progress with a weekly cadence
1 hr- 1
Pick the outcome metrics
Choose three to five results you report upward: revenue against quota, win rate, average deal size, sales cycle length and pipeline coverage. Review them monthly and at quarter end.
- 2
Pick the activity metrics
Choose the few seller actions your process depends on, such as meetings booked, discovery calls held and follow-ups sent, and review the trend weekly by rep.
- 3
Write the process as rules
Turn each step your team has agreed on into a sentence a computer can check: a condition, the deals it applies to, and the fix. Start with six to ten rules.
- 4
Check the rules against every open deal every night
Run the rules automatically against all open deals so each rep starts the day with a list of violations and the manager never has to read records to find them.
- 5
Run the weekly review in order
In a 30-minute weekly review, read process adherence first (which rules fire most, and on whom), then activity trends, then the outcome forecast. Fix a step when a rule fires across the team; coach a rep when it fires on one person.
A car dashboard carries three kinds of reading. The odometer tells you how far you have come. The tachometer tells you how hard the engine is working. And a row of small warning lights, oil and temperature and tire pressure, tells you something is wrong before the engine seizes. A driver who watched only the odometer would learn about the oil on the shoulder of the highway.
To track sales progress, measure three things on a fixed weekly cadence: outcomes (revenue, win rate, quota), activity (calls, meetings, emails) and process adherence (whether each open deal meets the steps your team agreed on), and read adherence first. The pages that rank for this question today hand you between ten and thirty metrics, and nearly all of them sit in the first two buckets. Highspot’s list of 30 sales performance metrics, updated September 2026, sorts them into quantity, quality, productivity and efficiency (Highspot). Zoom’s six-step guide recommends a Friday half hour with conversion rate, deal value and cycle length (Zoom). None of them tracks whether the work your team agreed to do got done. That third reading is the one that moves first.
What should you track to measure sales progress?
Sales team performance metrics fall into three layers, and each answers a different question for a different person at a different speed.
- Outcome metrics. Revenue against quota, win rate, average deal size, sales cycle length, pipeline coverage. They answer “where did we land?” and they belong to the board and the CFO. They move over months.
- Activity metrics. Calls made, meetings held, emails sent, proposals out. They answer “how hard did the team work?” and they move daily. Our post on sales activity metrics goes deeper on which ones to count.
- Process adherence. The share of open deals that meet the steps your team agreed on: an amount once a deal passes Discovery, a recap after each meeting, a named decision maker before Proposal. It answers “did the work that wins deals happen, deal by deal?” and it changes overnight.
| Layer | Example metrics | What it tells you | How fast it moves | What you can do with it this week |
|---|---|---|---|---|
| Outcomes | Revenue vs quota, win rate, cycle length | Where you landed | Months | Little; the deals that made it are closed |
| Activity | Meetings held, follow-ups sent | How hard the team worked | Daily | Ask for more effort |
| Process adherence | Open violations by rule and by rep | Whether the agreed steps happened on each deal | Overnight | Fix a specific deal, coach a specific rep, repair a specific step |
If you want the full catalogue of outcome measures, our guide to sales KPIs lists them with formulas. This post is about the order you read them in, and the cadence that makes them useful.
Why are outcome metrics too slow to steer by?
Outcomes are the reason the job exists, so track them without apology. The trouble is timing. Randy Illig, writing for FranklinCovey, put the problem in one line: “by the time you see the result, the performance that drove it has already happened” (FranklinCovey, June 2025). A win rate that dropped in August reports decisions buyers made in May.
More analysis of the result does not fix the lag. Gartner surveyed 303 sales leaders in July 2023, and 84% agreed that sales analytics had less influence on sales performance than leadership expected; the top barriers were data privacy (45%), poor data quality (44%) and weak cross-functional collaboration (44%) (Gartner, February 2024). Better charts of the odometer still tell you only how far you drove.
Are activity metrics enough to track sales performance?
Activity tracking is good and necessary. It is how you see that the work is being done at all, and a rep who held no discovery calls this week will not have a pipeline next month. So count the actions your process depends on.
The limit is that a count of actions says nothing about which way the deal moved. Fifty calls can be fifty calls to the same three people who will never buy. And once a count becomes a target, it bends. The social scientist Donald Campbell described this in 1979: “The more any quantitative social indicator is used for social decision-making, the more subject it will be to corruption pressures and the more apt it will be to distort and corrupt the social processes it is intended to monitor” (Campbell, 1979). Set a target of 60 dials a day and you will get 60 dials, some of them to voicemail on purpose.
Illig makes a sharper point in the same FranklinCovey piece. Proposals and pipeline, two numbers sales teams treat as early signals, are lag measures in his framing, because they are already results of earlier work. The tachometer tells you the engine is busy. It cannot tell you the oil is low.
What makes process adherence the leading indicator?
FranklinCovey’s 4 Disciplines of Execution gives a clean test for a leading indicator, which it calls a lead measure. In Illig’s words, lead measures are “predictive, meaning they lead to the accomplishment of the lag measure or goal” and “influenceable, meaning you can do something about them.” Run the three layers through those two tests.
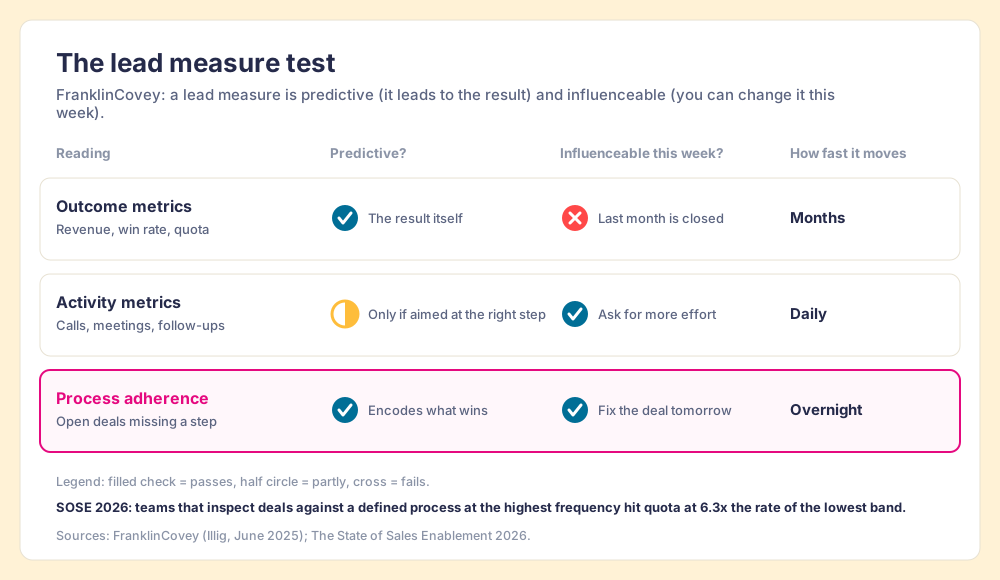
Outcomes fail the second test: nothing you do this week changes last month’s win rate. Activity passes the second test and half-passes the first, because effort predicts results only when it is aimed at the right step. Adherence passes both. A rule like “no deal past Discovery without an amount” is something a rep can satisfy tomorrow, and it encodes your team’s own belief about what wins.
The evidence that it predicts comes from our own research. In The State of Sales Enablement 2026, teams that inspect deals against a defined process at the highest frequency hit quota at 6.3x the rate of the lowest band. In the same survey, 48% of reps on highly inspected teams landed at 76 to 100% of quota, against 6% on rarely inspected teams. And 89% of teams had a defined process while 36% saw reps run it. The rules exist. The checking is what separates the bands.
Medicine ran the same experiment with better controls. In 2009, Alex Haynes, Atul Gawande and colleagues introduced a surgical safety checklist in eight hospitals, from Toronto to Ifakara. Across 7,688 patients, deaths fell from 1.5% before the checklist to 0.8% after, and complications fell from 11.0% to 7.0% (Haynes et al., New England Journal of Medicine, 2009). Same surgeons, same operating rooms. What changed was whether the agreed steps happened, checked at the moment they mattered.
How do you turn your sales process into something you can track?
A process you can track is a list of sentences a computer can check. Each one has a condition, the deals it applies to, and the fix. Take the sentences your managers already say out loud in pipeline meetings and rewrite them that way.
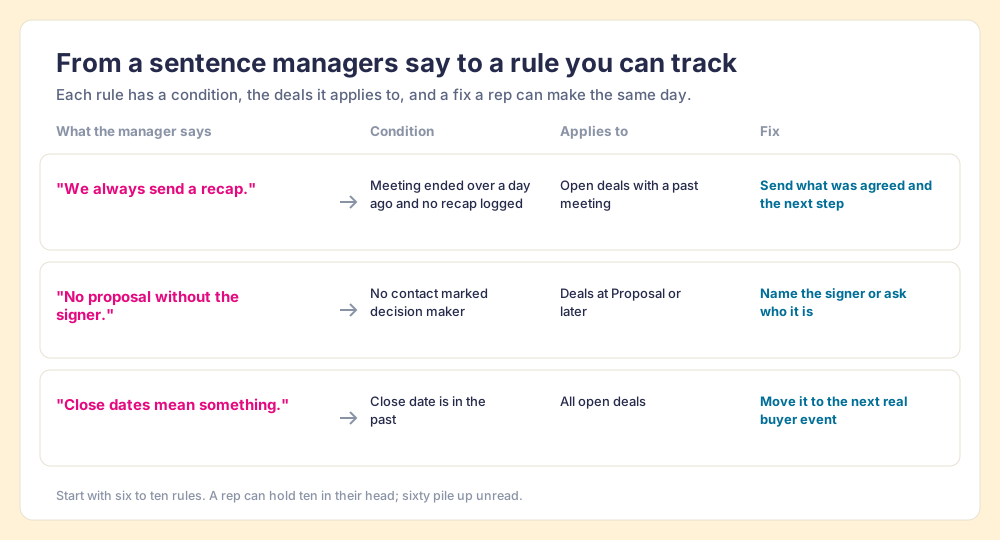
A few rules of thumb from writing these for my own deals and, before Supered, for RevPartners clients:
- Six to ten rules to start. A rep can hold ten rules in their head. Sixty pile up unread, and the board becomes noise.
- Rules that protect the buyer. Half of a good rule set is about the buyer’s experience: an agenda before the call, a recap after it. A stage should reflect the buyer’s real position, and these rules are how you see it.
- Rules a rep can satisfy in a day. “Improve discovery quality” is a wish. “No deal in Proposal without a named decision maker” is a rule.
- Rules that run without a person. The check runs against every open deal every night, so no manager has to open records to find the misses.
CRM hygiene covers the data side of these rules in depth, including why most violations appear on their own as the calendar turns.
What does the weekly cadence for tracking sales progress look like?
Each reading gets reviewed at the speed it moves. Review revenue weekly and you will mostly watch noise; review adherence quarterly and you will learn about a missed recap 90 days after the buyer noticed it.
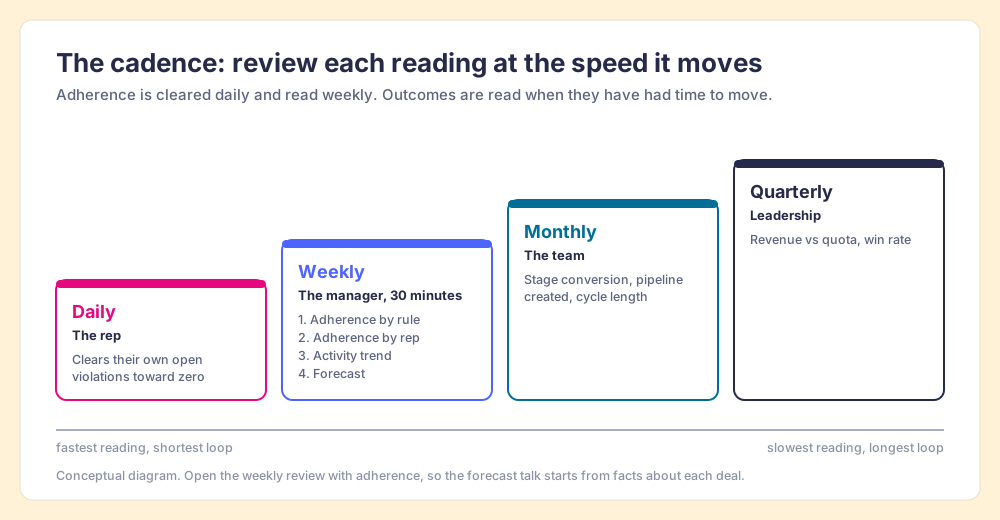
- Daily, the rep. The rep starts the day with their own list of open violations and works it toward zero. The list is theirs, so the fix happens while they still remember the call.
- Weekly, the manager. A 30-minute review in a fixed order: adherence by rule, adherence by rep, the activity trend, then the forecast. Reading adherence first means the forecast conversation starts from facts about each deal.
- Monthly, the team. Conversion rates between stages, pipeline created, cycle length. Enough weeks have passed for a trend to mean something.
- Quarterly, leadership. Revenue against quota, win rate, the board numbers. By now you should not be surprised by them, because the weekly reviews have been reading the warning lights.
The weekly order matters more than it looks. Pipeline meetings that open with the forecast turn into negotiations over a number. Meetings that open with “these four rules fired most this week” turn into a discussion of the process, which is the only part of the number a manager can still change.
What does this look like on a real Process Board?
The example below is one night on my own deals, an anecdote with no claim to be an average. I run a board called Zero Board under a ruleset called Sales Expectations: 22 rules checked against my open deals. Late one night it showed 11 violations: close dates in the past, no amount past Discovery, overdue tasks, no pre-call email within 24 hours, no recap sent, and no decision maker named.
With Supered, HubSpot and Gmail connected to Claude, I typed one prompt asking it to fix my violations and draft anything that needed an email. It updated fields from the context in my notes and calendar and saved the recap and pre-call emails to Gmail drafts for me to read. By hand that pass takes me about 45 minutes; this took about 10. The next morning the Slack summary showed 0 violations across all boards, with Caleb King on a 5-day streak and me on 4.
The number I track is the count of open violations, and the goal is zero. It is the warning-light reading from the dashboard: it tells me tonight which deals have a step missing, while there is still a buyer to send the recap to.
How do you improve sales performance with what you track?
The weekly review produces two kinds of finding, and they call for different fixes.
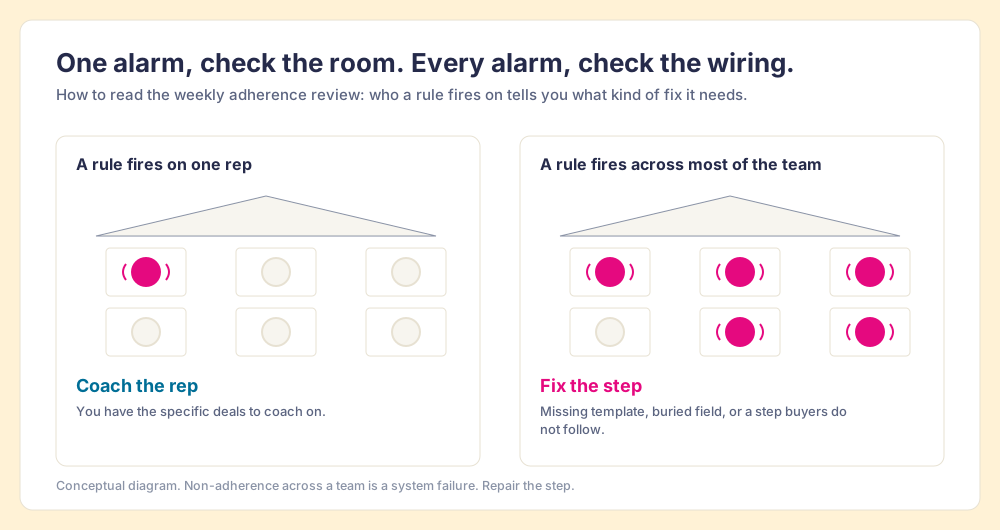
When one smoke alarm in a building goes off, you check that room. When all of them go off, you check the wiring. A rule that fires on one rep is a coaching conversation, and you now have the specific deals to coach on. A rule that fires across most of the team is a broken step: the template is missing, the field is buried, or the step does not fit how buyers buy. The failure sits in the system, and blaming the reps will not change it. Fix the step.
Managers cannot do this reading by hand at scale. In our survey, the most-cited reason reps skip the process was that managers do not enforce it (29%), and it is mostly a capacity problem: managers run out of hours long before they run out of intent. Software can read every open deal every night. That leaves the manager’s hours for the coaching.
What we recommend
There are three ways to track sales progress, and teams usually pick by habit:
- Outcomes only. Easy to set up, and it reports the trip after it is over.
- Outcomes plus activity. What most dashboards do. It shows effort, and it bends once the counts become targets.
- Outcomes, activity and process adherence, read in reverse order. The approach we recommend.
Choose the third. Write your process as six to ten rules, check them against every open deal every night, have reps clear their own lists daily, and open the weekly review with adherence before the forecast. The case rests on the evidence above: adherence is the only reading that passes both lead-measure tests, the surgical checklist moved outcomes by checking steps, and teams that inspect deals against a defined process at the highest frequency hit quota at 6.3x the rate of the lowest band.
In Supered, the rules live as Process Rules inside a Process Ruleset, and a Process Board tracks every open deal against them in HubSpot, Salesforce or Pipedrive. Reps see their violations where they already work, in the CRM or in Claude, and managers see who followed the process and which rules fire most. Process Compliance is $40 per user per month paid yearly, with a 5-user minimum (pricing). The sales expectations use case shows the full setup, including the morning summary.
If your team already has rules and the board still looks clean while deals stall, read pipeline hygiene next: it covers why a board can pass every rule and still misread the buyer. For the case behind adherence as the lever, sales process adoption walks through why reps drift and what closes the gap. Or book a demo and bring the sentences your managers repeat in pipeline meetings; we will turn them into your first rules.
Frequently asked questions
What is the best way to track sales progress?+
What sales team performance metrics should a manager track weekly?+
What is the difference between leading and lagging sales indicators?+
How do you track whether reps follow the sales process?+
How do you improve sales performance once you are tracking it?+
How often should you review sales performance?+
Your process, running itself.