User Adoption Metrics: Count the Work, Then the Logins
Most user adoption metrics count who showed up. For a CRM, the number that decides whether the rollout worked is the share of records where the work happened the way your team agreed. The four-rung ladder, the formulas, and the change management KPIs that go with it.
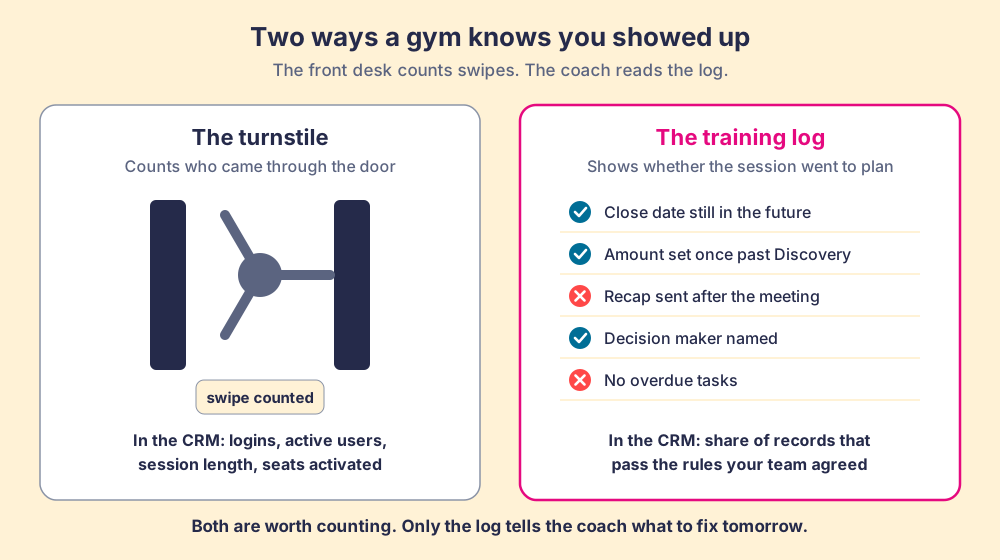
User adoption metrics are the numbers that tell you whether the people you bought software for use it to do the work the way you intended, and for a CRM they sit on four rungs: presence, activity, adherence and outcome.
A gym knows two things about you. The turnstile knows you came through the door, and it counts that faithfully, swipe after swipe. Your coach knows something else: whether the session in your training log went the way the plan said. A member can swipe in four times a week for a year and never lift the bar the program called for. The turnstile will report a model member. The log will tell the truth.
User adoption metrics are the numbers that tell you whether the people you bought software for use it to do the work the way you intended, and for a CRM they sit on four rungs: presence, activity, adherence and outcome. The pages that rank for this term today count the turnstile. Toucan’s list of 12 adoption KPIs leans on daily and monthly active users, usage frequency and time spent (Toucan, updated January 13, 2026). UXCam’s five are active users, retention, churn, session length and time to value (UXCam). Both are written for a company watching customers use its own app, and for that job they are good lists. For a CRM rolled out to your own sales team, they stop one rung short of the number that decides whether the rollout worked.
What are user adoption metrics, and what do the top lists leave out?
Gainsight’s glossary gives the cleanest definition in the field: adoption metrics describe “how often customers use the product or service, which features they are using, and what they are doing with those capabilities” (Gainsight glossary). The first two clauses are easy to count, and the lists count them. The third clause, what people are doing, is where a sales team lives or dies, and it gets the least attention.
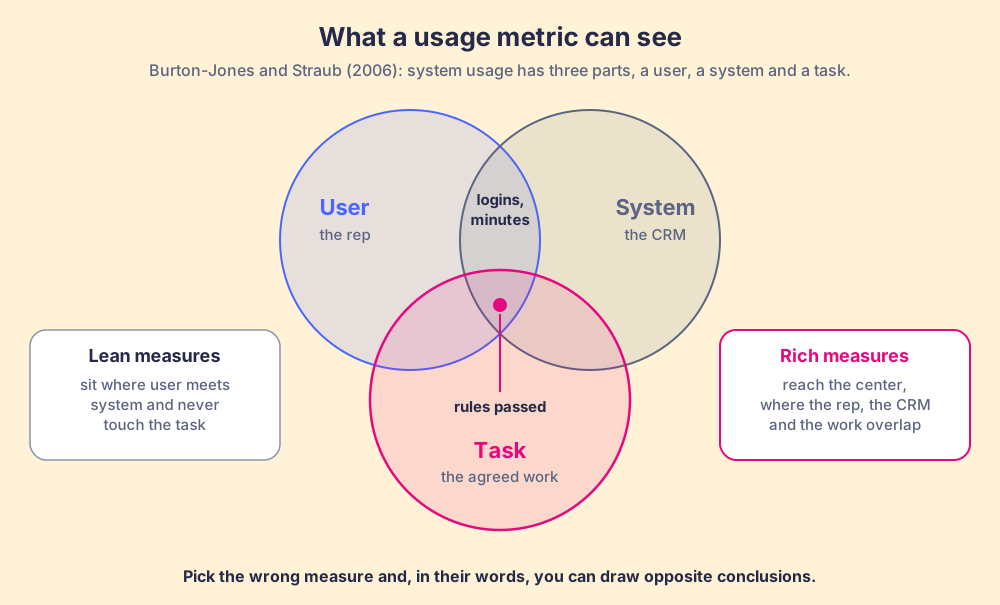
The academic version of this problem is twenty years old. Andrew Burton-Jones and Detmar Straub, writing in Information Systems Research in 2006, noted that system usage “boasts no widely accepted definition” and has been measured by “a diverse set of unsystematized measures.” Their fix was to define usage as three parts: “a user, system, and task.” Then they ran an experiment and found that “an inappropriate choice of usage measures can lead researchers to draw opposite conclusions” (Burton-Jones and Straub, ISR 17(3), 228-246).
Read that against a CRM dashboard. A login touches the user and the system. Minutes in the app touch the user and the system. Neither one touches the task, which for a sales team is the deal moving through the stages the way the team agreed it should. Burton-Jones and Straub called measures like these lean, and put the difference in one line: “Lean measures reflect usage alone; rich measures reflect its nature, involving the IS, user, and/or task” (working paper version). Duration of use is their example of a lean measure.
Why can’t logins tell you whether a CRM is adopted?
Because a login is a fact about a person and a door, and the thing you bought the CRM for is a fact about a deal. Logins still matter. A rep who never signs in cannot follow any process, and checking seat activation in the first weeks is good practice. Trouble starts when the login becomes the target.
Donald Campbell put the mechanism into one sentence in 1979: “The more any quantitative social indicator is used for social decision-making, the more subject it will be to corruption pressures and the more apt it will be to distort and corrupt the social processes it is intended to monitor” (Campbell’s law, Evaluation and Program Planning 2(1)). Tell a team that adoption means logging in daily, and logins rise. No rep has to cheat. The rep opens the CRM with the morning coffee, the counter ticks, and the deal that needed an amount two weeks ago still has none.
The gap between reach and behavior is large in sales. In The State of Sales Enablement 2026, 89% of teams say they have a defined sales process and 36% see reps run it, a 53-point gap (The State of Sales Enablement). Those teams almost all have CRM logins. What they lack is a number at the record that shows whether the process ran.
WalkMe’s guide to Salesforce adoption metrics, which ranks for this term, lists 25 measures and opens with login frequency: “Low login rates show users aren’t engaging with Salesforce and may rely on manual work or old systems” (WalkMe, May 8, 2025). That sentence is right. Further down the same list sit “opportunities with missing or outdated close dates” and “contacts and accounts missing key fields,” which are record-level checks of the process. WalkMe has the right measures in the list. The list opens with the easiest number to pull and reaches the one that decides the rollout at number eight.
Which user adoption metrics should you track for a CRM?
Think of the metrics as a ladder you climb in order. Each rung answers a question the one below it cannot, and skipping a rung means guessing.
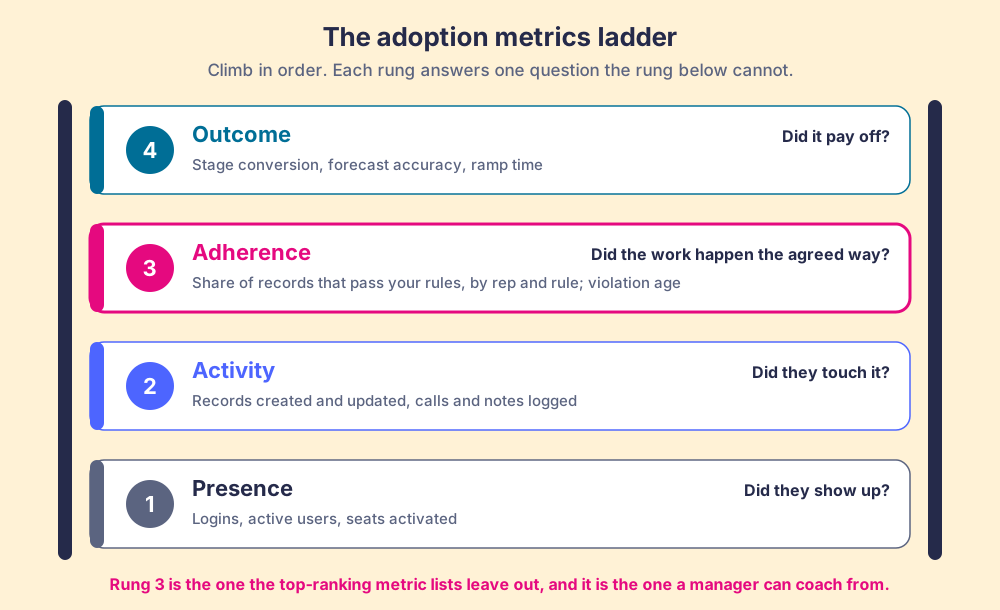
- Presence. Seat activation and active users. Answers whether the rollout reached people. Check it weekly for the first month, then monthly.
- Activity. Records created and updated, calls and notes logged. Answers whether people touch the system. Useful for spotting a rep who works from a spreadsheet.
- Adherence. The share of in-scope records that pass the rules your team agreed, cut by rep and by rule, plus how long each violation stays open. Answers whether the process ran. A manager can coach from this rung, because each failure names a record and a fix.
- Outcome. Stage conversion, forecast accuracy, new-rep ramp time. Answers whether the process paid off. It lags by months, so it cannot steer a rollout week to week.
Here are the formulas I would put on a CRM adoption dashboard, rung by rung:
| Rung | Metric | Formula | What it cannot tell you |
|---|---|---|---|
| Presence | Seat activation | Users active in the last 30 days ÷ paid seats | Whether any deal moved |
| Activity | Record touch rate | Open deals updated in the last 7 days ÷ open deals | Whether the update was the right one |
| Adherence | Adherence rate | In-scope records passing all rules ÷ in-scope records | Whether the rules are the right rules |
| Adherence | Violation age | Median days a rule violation stays open | Why the rep missed it |
| Outcome | Stage conversion | Deals reaching the next stage ÷ deals entering the stage | Which behavior caused the change |
The adherence rate needs rules before it needs software. Write down what a healthy record looks like for your team. On my own deals I run a board with 22 rules, and one night recently it showed 11 violations: close dates in the past, no amount past Discovery, overdue tasks, no pre-call email within 24 hours, no recap sent, no decision maker. One night on one board proves nothing about averages. The point is the shape. Each violation names one deal and one missing step, which a login count never could.
How do you measure adherence without burying your managers?
By checking the rules automatically, every night, and keeping the human hours for the coaching conversation. Inspection works: in The State of Sales Enablement 2026, teams that inspect deals against a defined process at the highest frequency hit quota at 6.3x the rate of the lowest band. The trouble is the hours. Adherence is 47% on teams where a manager has one to five reps and 23% where they have six to eight, and the top reason reps skip the process is that managers do not enforce it (29%) (The State of Sales Enablement). Same managers, more records than hours.
Three design choices keep the adherence rung trustworthy:
- Few rules, written down. Five to ten rules that protect the buyer’s experience or the forecast. A rule a manager cannot explain to a rep becomes a box reps fill with whatever passes.
- Checks on records, automatic. Software reads every in-scope record on a schedule. A manager reading records by hand covers a sample at best.
- Fixes delivered where the rep works. When a rule fails, the fix shows up in the CRM screen the rep already has open. The State of Sales Enablement found quota attainment of 49% where guidance is embedded in the workflow, against 15% where it lives in docs or wikis.
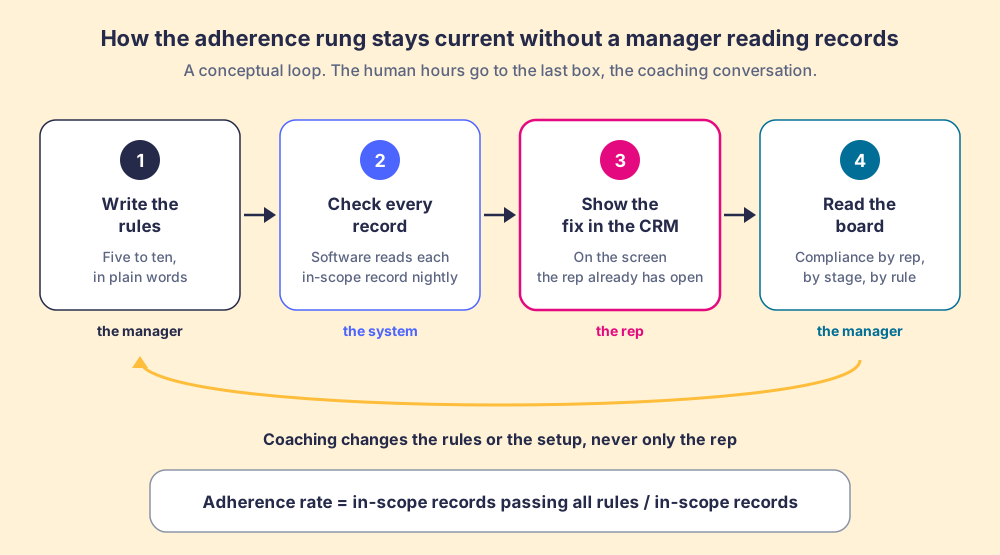
The last point is why I treat adherence as a system measure. When a record fails a rule, the first question is what about the setup made the miss easy, and only then which rep. Forrester’s survey of 414 people who had worked on CRM projects found 38% blamed “people issues such as slow user adoption, inadequate attention paid to change management and training” (Forrester, February 18, 2016). People issues, in that survey’s wording, are mostly design issues seen from the manager’s chair, which is the argument I make at length in CRM adoption.
Which change management KPIs show a rollout worked?
Prosci, the firm behind the ADKAR model, lands close to where I do on change management metrics. Its digital adoption guidance says to watch “consistent usage of core workflows (not just logins),” and to focus on “speed of adoption, ultimate utilization, and proficiency” (Prosci, updated September 18, 2026). The same article cites Prosci research that projects with excellent change management are seven times more likely to succeed.
I would extend Prosci one step. Its three change management KPIs can each be counted at the login or at the record, and the record version is the one that tells you the work changed.
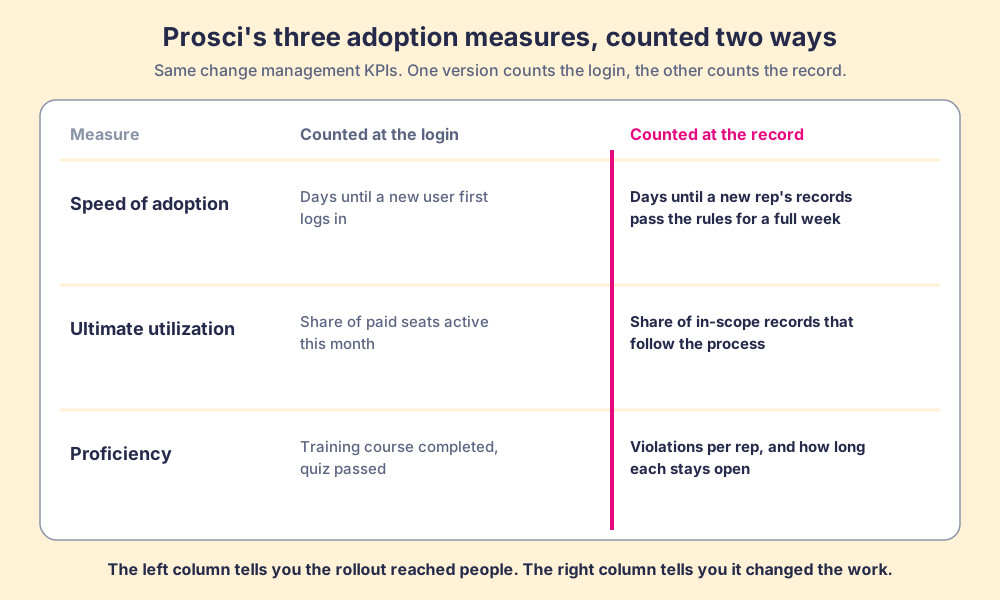
- Speed of adoption. Days until a new user’s records pass your rules for a full week. First login is a start date for the clock, nothing more.
- Ultimate utilization. The share of in-scope records that follow the process, tracked over months. Seat activity tops out near 100% early and stops telling you anything.
- Proficiency. Violations per rep and how long each stays open. A quiz score measures what someone knows. Open violations measure what they do when the buyer is waiting.
What digital adoption challenges break the numbers?
Four come up again and again, and each one corrupts a metric in a predictable way.
- The breadth trap. Pendo’s 2019 Feature Adoption Report, across 615 customer subscriptions, found that “80 percent of features in the average software product are rarely or never used,” and estimated public cloud companies spent up to $29.5 billion building them (Pendo). A dashboard that rewards feature breadth pushes reps toward features the process never calls for.
- The login target. Campbell’s law at work. Once logins carry a consequence, they rise, and the rung above stays flat.
- The training proxy. Course completion stands in for proficiency. Knowing better is not doing better, and the gap shows up only at the record.
- The guidance in the wrong place. Help that lives in a wiki asks the rep to leave the work to find it. The 49% against 15% gap above is the cost of that trip.
That breadth trap is why a feature adoption strategy for internal software should start from the process and work backward. Pick the two or three features your process depends on, such as logging notes after a meeting or setting an amount after discovery, and measure them as rules on records. A product team measuring its own app has good reasons to chase breadth. A sales team adopting a CRM does not. For the rollout side of this, CRM onboarding and in-app training cover how to get reps to that first clean week.
Where Supered fits
Supered covers two of the rungs above, in the CRM screen where reps already work. The Digital Adoption plan puts cards, step-by-step guides and page triggers inside HubSpot, Salesforce and Pipedrive, so the help a rep needs appears on the record they are editing. It costs $13.50 per user per month paid yearly, or $15 paid monthly (pricing).
Process Compliance adds the adherence rung. You write Process Rules, Supered checks them against your records, and a Process Board shows compliance by rep, by stage and by rule, with the failing records one click away. It costs $40 per user per month paid yearly, with a five-user minimum, and includes everything in Digital Adoption. Action plans for onboarding a new rep are completion-tracked and visible to the manager, which gives you the speed-of-adoption clock without a spreadsheet. The onboarding and ramp use case shows how teams put the pieces together.
Choose something else if you are measuring how customers adopt your own software product: Pendo and Gainsight are built for that job, and their click and retention analytics go deeper than anything a CRM tool offers. Choose something else too if your team works mostly in the field on phones, because Supered has no mobile product.
What we recommend
There are three ways to run user adoption metrics for a CRM. You can track presence and activity and call the rollout done when seats go green. You can add outcome metrics and wait months to learn whether anything changed. Or you can climb the ladder in order, and put the weight on adherence.
I recommend the third, for reasons that come straight from the evidence above:
- A measure that reaches the task. Burton-Jones and Straub showed that lean usage measures can point the opposite way from the truth. Rules checked on records are the rich measure for sales work.
- A target that resists gaming. Campbell’s law punishes a login target. A rule on a record can be gamed only by doing the work, or by filling a field with a guess, which the next rule catches.
- A number a manager can coach from. Adherence names a record, a rule and a fix. Teams that inspect at the highest frequency hit quota at 6.3x the rate of the lowest band.
- A rollout measure that keeps working. Prosci’s three KPIs, counted at the record, keep moving long after seat activation has topped out.
Keep the turnstile. It tells you who came in. Then read the log, because the log is where the coaching happens. For the reasons reps skip the CRM in the first place, read CRM adoption; for the nightly rule check that feeds the adherence rung, read CRM hygiene; and for what changes when the whole process is followed, read sales process adoption. Or book a demo and we will build your first adherence board from your own rules.
Frequently asked questions
What are user adoption metrics?+
What is a good user adoption rate for a CRM?+
What are the best change management KPIs for a software rollout?+
Why are login counts a weak measure of user adoption?+
How do you measure feature adoption inside a CRM?+
What tools measure user adoption metrics in HubSpot or Salesforce?+
Your process, running itself.