Sales Enablement Statistics 2026: Every Number Sourced and Dated
The 2026 sales enablement statistics worth citing, grouped and dated, each linked to the report that published it. Read side by side, they show enablement inputs climbing while seller outcomes slide, and point to where the gap sits.
Sales enablement statistics are measured data points on how revenue teams train, equip, coach, and inspect sellers, and on what that work does to ramp, win rates, and quota; each 2026 figure below is dated and linked to the source that published it.
A cook who wants to know why dinner keeps coming out late can count two things: what is on the shelves, and what leaves the kitchen on a plate. Sales enablement has spent a decade counting shelves. So when you line up the 2026 sales enablement statistics side by side, the first thing you see is a pantry that fills every year while fewer plates go out.
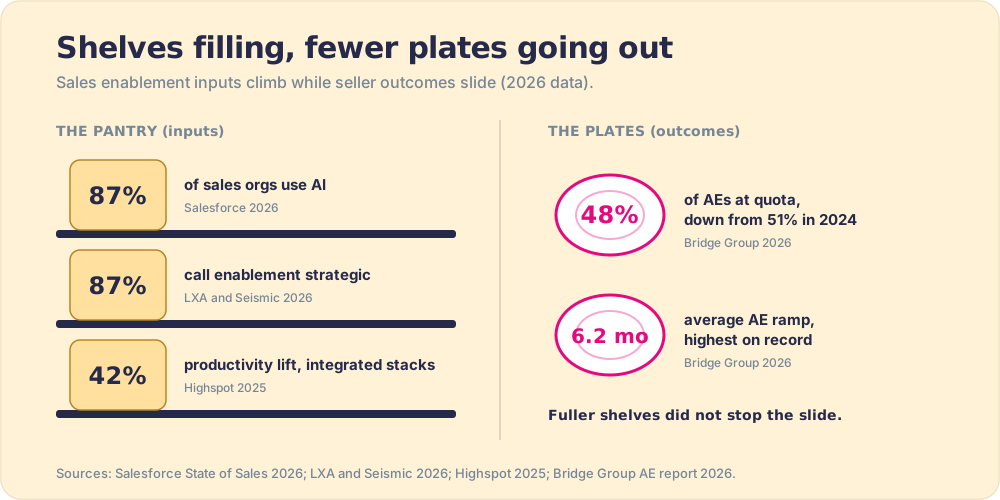
Start with the stocking. 87% of sales organizations now use some form of AI (Salesforce, 2026). Strategic commitment to revenue enablement sits at a four-year high of 87% (LXA and Seismic, 2026). Then the cooking. 48% of account executives hit quota in 2026, down from 51% in 2024, and average AE ramp reached 6.2 months, the longest the Bridge Group has recorded (Bridge Group, 2026).
Bridge Group ties the longer ramp to deal complexity and bigger buying committees, so the shelves did not cause the missed plates. But full shelves did not prevent them either, and that is the pattern this page documents: sales enablement data on inputs climbs, data on outcomes slides, and the numbers that explain the difference describe whether the process ran, which is what our own research measured.
We kept one rule for this page. A number made the list only if we opened the publisher’s own page or report, or a reputable page citing it, and every one carries its year. That rule cut a handful of popular sales enablement stats we found repeated across roundup pages and could not trace to anyone who measured them. Older classics stay only where nothing newer measures the same thing, flagged as older.
What do the 2026 sales enablement statistics say, in brief?
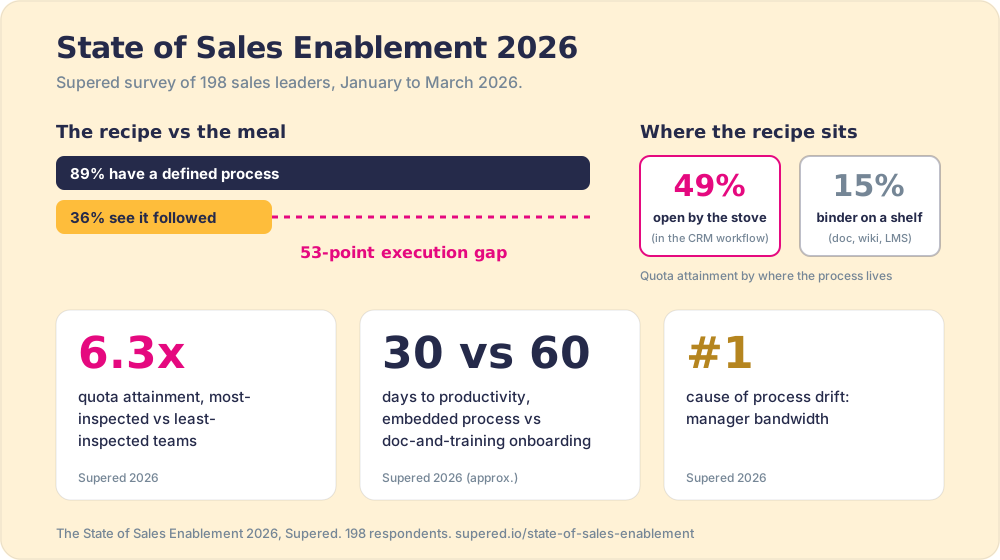
- The execution gap. 89% of sales leaders have a defined sales process; 36% see it followed as designed, a 53-point gap (Supered, 2026).
- Inspection. Teams whose managers inspect process compliance weekly hit quota at 6.3x the rate of the least-inspected teams (Supered, 2026).
- Where the process lives. Teams with the process inside the CRM workflow report 49% quota attainment versus 15% for doc, wiki, and LMS teams (Supered, 2026).
- Quota. 48% of AEs reached quota in 2026, down from 51% in 2024 (Bridge Group, 2026).
- Ramp. Average AE ramp is 6.2 months, the highest in the study’s history (Bridge Group, 2026).
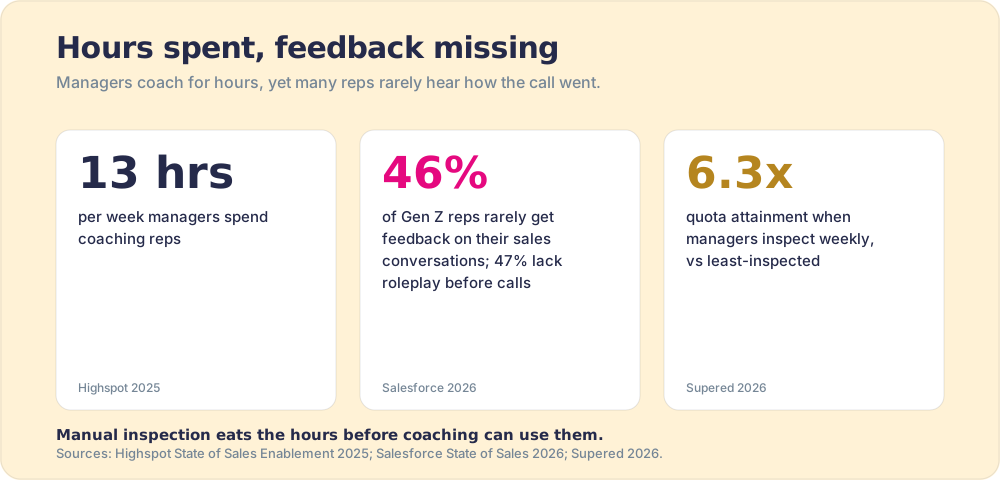
- Feedback. 46% of Gen Z sales reps rarely get feedback on their sales conversations (Salesforce, 2026).
- AI. 87% of sales orgs use AI, but 6% of revenue leaders call it central to how their team operates (Salesforce 2026; LXA and Seismic 2026).
- Buyers. 67% of B2B buyers prefer a rep-free experience, and 69% still want a rep to validate what AI told them (Gartner, 2026).
What did Supered’s State of Sales Enablement 2026 find?
We surveyed 198 sales leaders from January through March 2026 at companies running HubSpot or Salesforce with at least 10 reps. The survey measured whether the process a leader designs is the process reps run.
- Defined process. 89% of sales leaders say their team has a defined sales process (State of Sales Enablement 2026).
- Process followed. 36% say reps follow that process as designed (Supered, 2026).
- The execution gap. The 53-point distance between those two numbers is what we call the Enablement Execution Gap (Supered, 2026).
- Inspection multiplier. The most-inspected teams, where managers review process compliance weekly with a real number, hit quota at 6.3x the rate of the least-inspected teams (Supered, 2026).
- Delivery medium. Teams whose process lives inside the CRM, in the flow of the work, report 49% quota attainment; teams whose process lives in a doc, wiki, LMS, or recorded video report 15% (Supered, 2026).
- Ramp by delivery. New hires on embedded-process teams reach productivity in roughly 30 days, versus roughly 60 days on doc-and-training onboarding (Supered, 2026).
- Top cause of drift. The most-cited reason process compliance erodes is manager bandwidth: managers cannot check every step on every deal, so compliance falls to whatever time they have (Supered, 2026).
The 49% versus 15% finding is the kitchen picture again. Same recipe, same cooks. In one kitchen the card sits open on the counter by the stove; in the other it is filed in a binder on a shelf down the hall. The recipe did not change between the two rooms. The distance to it did.
Methodology note for the SOSE findings
Respondents were screened to VP Sales, Head of Sales, CRO, RevOps, and sales enablement leads. The title mix was 41% sales executives, 24% RevOps, 19% enablement leads, and 16% other senior revenue roles; 56% ran HubSpot and 40% Salesforce, and mid-market and SMB teams were oversampled. Twelve respondents also sat for extended interviews. The gap is self-reported, so we cross-checked it against three other compliance measures, and the result held within 4 points. Supered sells software aimed at this gap, which is a reason to read the numbers with care and a reason we publish the method. The full breakdown lives on the State of Sales Enablement page.
Which sales enablement statistics show where the process breaks?
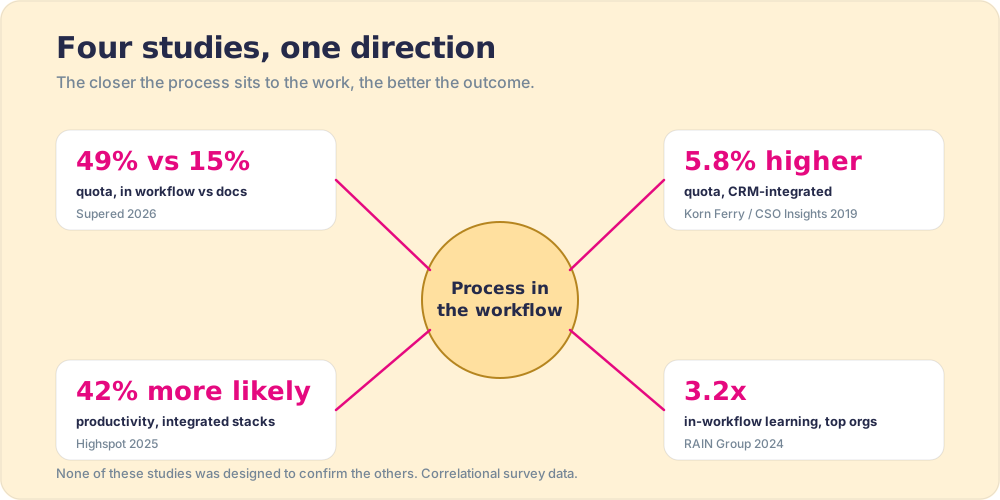
The third-party research agrees with our field data from an unexpected angle. The other studies did not ask about the execution gap by name, but four of them measured where the process sits or how formally it is run, and those two dials moved outcomes.
- CRM-integrated enablement. Organizations that integrate enablement into the CRM post quota attainment 5.8% higher than average (Korn Ferry / CSO Insights, 2019; older study).
- Chartered enablement. Teams running enablement from a formal charter post a 55.1% win rate versus 39.2% for a random approach (Korn Ferry / CSO Insights, 2019; older study).
- Integrated tech stacks. Companies with well-integrated enablement stacks are 42% more likely to increase sales productivity (Highspot, 2025).
- Execution overall. 55% of organizations say they cannot effectively drive their go-to-market initiatives (Highspot, 2025).
- Learning in the workflow. Among companies with highly effective training, 20% strongly agree learning content is available in the workflow, 3.2x the rate of less effective peers (RAIN Group, 2024).
- Transformation success. Only 11% of sales organizations drove commercial success while executing a transformation (Gartner, 2024).
Four independent sources, one direction. The closer the process sits to the work, the better the number: our 49% versus 15%, Korn Ferry’s 5.8% lift for CRM-integrated enablement, Highspot’s 42% for integrated stacks, RAIN’s 3.2x for in-workflow learning. None of these studies was designed to prove the others right. When unrelated surveys land on the same side, the finding is harder to wave off.
How long does sales ramp take? Onboarding and ramp statistics
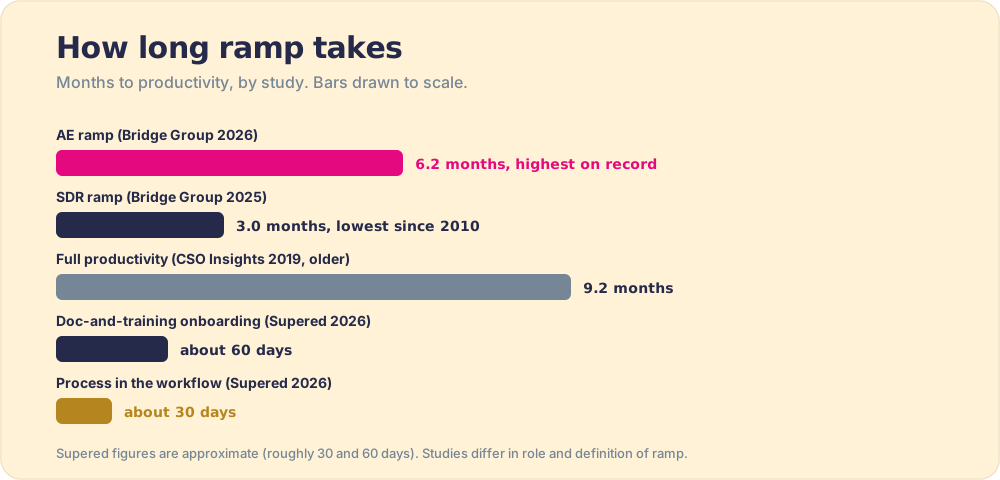
Ramp is the cleanest test of enablement, because a new hire has nothing to fall back on but what the team hands them. The 2026 figures run the wrong way for AEs and the right way for SDRs. For the full treatment, see our guide to sales ramp time.
- AE ramp. Average AE ramp time is 6.2 months, the highest in the study’s history, across 158 B2B companies (Bridge Group, 2026).
- SDR ramp. Average SDR ramp is 3.0 months, the lowest since 2010 and down from a 3.8-month peak in 2014 (Bridge Group, 2025).
- SDR attrition. Median annual SDR attrition was 40% in 2024 (Bridge Group, 2025).
- Full productivity. It took 9.2 months to get new sellers to full productivity, after 3.7 months to fill the seat (CSO Insights, 2019, via Highspot; older study).
- Onboarding that works. Organizations with highly effective training are 4.9x more likely to strongly agree their onboarding gets sellers productive quickly (RAIN Group, 2024).
- Measured training. Teams that use analytics to measure training effectiveness are 36% more likely to decrease ramp time (Highspot, 2024).
- Ramp by delivery. Embedded-process teams report roughly 30-day productivity versus roughly 60 days for doc-and-training onboarding (Supered, 2026).
How much of sales training and content gets used?
A training program is a meal served once. The sales enablement data on training says the cooking is uneven and the tasting is rarer still.
- Training effectiveness. Only 33% of sales professionals rate their organization’s training as extremely or very effective (RAIN Group, 2024).
- Unmeasured training. Organizations with less effective training are 13.8x more likely not to measure training effectiveness at all (RAIN Group, 2024).
- Current playbooks. 27% of effective-training organizations strongly agree their sales playbooks are current and accessible, 2.8x the rate of peers (RAIN Group, 2024).
- The upskilling gap. 87% rate training revenue teams as very or extremely important, 25% say their organization is highly successful at it, a 62-point gap (Harvard Business Review Analytic Services for Seismic, 2025).
- Unused features. 79.7% of enablement leaders say reps leave at least 40% of a stand-alone tool’s features untouched (Sales Enablement Collective Impact of Enablement Report, 2025).
- Skill overload. 72% of sellers feel overwhelmed by the number of skills their job requires, and overwhelmed sellers are 45% less likely to attain quota (Gartner, 2024).
- Inconsistent messages. 69% of B2B buyers report inconsistencies between a supplier’s website and what its sellers tell them (Gartner, 2025).
Notice the RAIN pairing. The less effective a training program, the less likely anyone measures it, which is how a program can run for years without learning it is the problem. The 62-point upskilling gap from HBR has nearly the same size and shape as our 53-point execution gap: leaders agree on the recipe, and far fewer see it cooked.
Are sales managers coaching and inspecting enough?
Coaching is where the numbers get personal. A rep who never hears how the last call went is a cook who never tastes the soup. Among the newest reps, that describes almost half.
- Rare feedback. 46% of Gen Z sales reps rarely get feedback on their sales conversations (Salesforce, 2026).
- Too little practice. 47% of Gen Z reps say they do not get enough roleplay before customer calls (Salesforce, 2026).
- Coaching struggle. 55% of organizations struggle with either sales training or coaching (Highspot, 2025).
- Manager coaching time. Managers spend 13 hours per week coaching reps (Highspot, 2025).
- AI-assisted coaching. Teams using AI-powered coaching are 36% more likely to report higher win rates (Highspot, 2025).
- Inspection multiplier. The most-inspected teams hit quota at 6.3x the rate of the least-inspected (Supered, 2026).
- Manager bandwidth. Manager bandwidth is the most-cited cause of process drift (Supered, 2026).
Put 13 hours a week of coaching next to 46% of Gen Z reps rarely hearing feedback, and effort looks like the wrong suspect. Manual inspection eats the hours before coaching can use them. The fix our data points to is taking the checking off the manager’s plate so those 13 hours go to the conversation, which is how inspection and coaching stop competing for the same afternoon.
What percentage of companies have a sales enablement function, and what do they spend?
The headcount question has an older answer than you would hope. The last large public count of enablement functions is from 2019; newer surveys track commitment, budgets, and alignment instead.
- Dedicated function. 61.3% of organizations had a dedicated sales enablement function in 2019, up from 61.0% in 2018, across more than 900 respondents (CSO Insights, 2019; older study).
- Formal charter. 15.8% ran enablement from a formal charter (CSO Insights, 2019; older study).
- Win rates with enablement. Win rates were 49.0% with enablement versus 42.5% without (CSO Insights, 2019; older study).
- Strategic commitment. 87% of revenue leaders call revenue enablement a strategic commitment, up 19 points since 2022 (LXA and Seismic, 2026; 201 leaders in the UK, Germany, and France).
- Proving ROI. 51% of revenue enablement leaders cannot demonstrate ROI to their executive team (LXA and Seismic, 2026).
- Budget plans. 41.9% of enablement leaders plan to increase their budgets this year (Sales Enablement Collective Impact of Enablement Report, 2025).
- Shrinking teams. 23.6% of enablement teams decreased in headcount over the past 12 months (Sales Enablement Collective, 2025).
- Metric alignment. 43.8% of enablement practitioners are aligned with senior leadership on metrics in 2025 (Sales Enablement Collective, 2025), compared with 51% in the 2024 survey (Sales Enablement Collective, 2024).
The 51% who cannot prove ROI and the 43.8% who do not share metrics with leadership are the same problem seen twice. If enablement is scored on what it ships, it cannot show what changed. Our sales enablement KPIs guide and the sales enablement ROI model both start from the output side for that reason.
How is AI changing sales enablement? AI statistics for 2026
AI is the fullest shelf in the pantry. Adoption numbers sit near 90%, and the performance numbers are real, but they cluster around one condition: AI tied to a clear next action inside a working process.
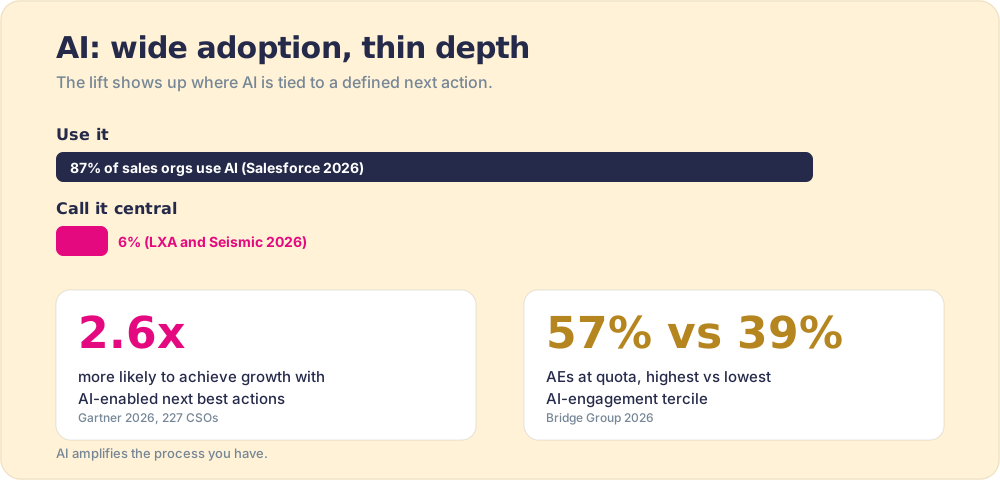
- AI use. 87% of sales organizations use some form of AI (Salesforce, 2026).
- Agents. 54% of sellers have used AI agents, and nearly 9 in 10 plan to by 2027 (Salesforce, 2026).
- AI plans. 90% of organizations use AI in go-to-market or plan to start (Highspot, 2025).
- Enablement tasks. Nearly 60% of organizations already use AI for at least one enablement task (HBR Analytic Services for Seismic, 2025).
- Depth of use. 6% of revenue leaders describe AI as central to how their revenue team operates (LXA and Seismic, 2026).
- AI and quota. Sellers who effectively partner with AI tools are 3.7x more likely to meet quota (Gartner, 2024).
- AI engagement and attainment. AEs in the highest AI-engagement tercile hit quota at 57% versus 39% in the lowest (Bridge Group, 2026).
- Next best actions. Sales organizations that give sellers AI-enabled next best actions are 2.6x more likely to achieve commercial growth (Gartner, 2026).
- AI upskilling. Organizations that prioritize upskilling sellers on AI are 2.4x more likely to achieve strong revenue growth (Gartner, 2026).
- Agent productivity (prediction). By 2028 AI agents will outnumber sellers 10 to 1, yet fewer than 40% of sellers will say agents improved their productivity (Gartner prediction, 2026).
- Stage velocity (prediction). By 2029, sales organizations with AI-driven enablement will achieve 40% faster sales stage velocity than those using traditional enablement (Gartner prediction, 2026).
The gap between 87% using AI and 6% calling it central is the pantry again. Gartner’s 2.6x finding is about next best actions, which is AI pointed at a defined step in a defined process. AI amplifies the process you have, so it compounds an adopted one and speeds up a broken one. We cover the shift in more depth in sales enablement trends.
How do B2B buyers want to buy in 2026?
The buyer is the reason any of this matters. The point of a process is a better, more consistent experience on the other side of the table, and buyer research says that experience is getting harder to deliver.
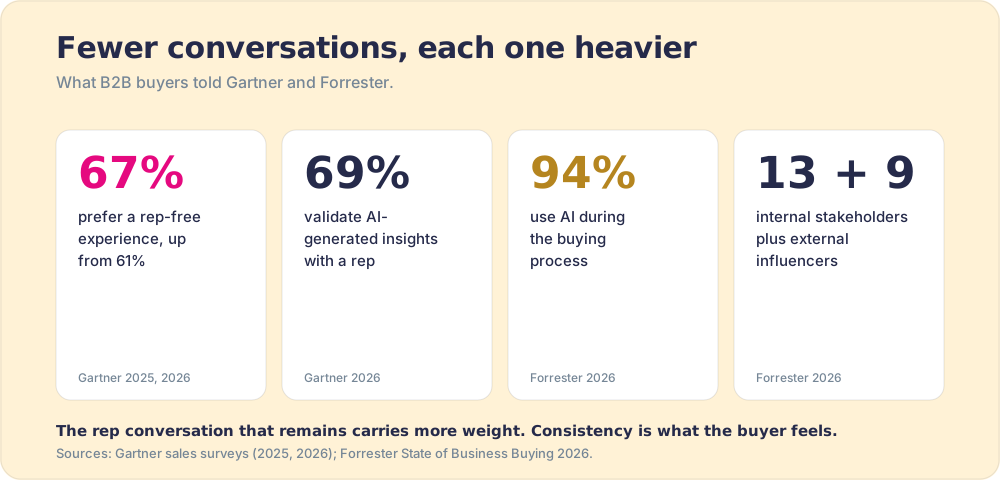
- Rep-free preference. 67% of B2B buyers prefer a rep-free experience, up from 61% a year earlier (Gartner, 2026; Gartner, 2025).
- Reps as validators. 69% of B2B buyers prefer to validate AI-generated insights with sales reps (Gartner, 2026).
- AI in buying. 94% of business buyers used AI during their buying process, across nearly 18,000 buyers (Forrester, 2026).
- Buying groups. The typical decision involves 13 internal stakeholders and nine external influencers (Forrester, 2026).
- Irrelevant outreach. 73% of B2B buyers actively avoid suppliers who send irrelevant outreach (Gartner, 2025).
- Rep plus digital. Buyers are 1.8x more likely to complete a high-quality deal when they use supplier digital tools together with a rep (Gartner B2B buying journey research, undated page).
- Longer cycles. 57% of sales professionals say the sales cycle is getting longer (Salesforce, 2026).
Read the first two together. Buyers want fewer rep conversations, and they lean on the ones they have to check what an AI told them. Fewer meetings means each one carries more weight, and a rep who improvises through it spends a scarce chance. Consistency is what the buyer feels.
What do these sales enablement statistics add up to?
Line the numbers up in order and they tell one story. Enablement inputs are at record highs: AI in 87% of sales orgs, commitment at 87%, tools consolidating. Outcomes are sliding: 48% of AEs at quota, 6.2-month ramps, 46% of Gen Z reps rarely hearing feedback. The studies that explain the difference all measure the same hidden step, whether the process ran, and they converge on two levers: put the process where the work happens, and inspect whether it was followed.
Before you buy, train, or change anything else, measure what share of your deals ran the process as designed. The other levers all sit downstream of that number. You cannot tell whether a new AI tool, coaching program, or playbook worked if you do not know whether the old process was being run.
Our data sizes the payoff at 6.3x for inspection and 49% versus 15% for delivery in the workflow, and Korn Ferry, Highspot, and RAIN point the same way from outside. The cost of skipping the baseline is the pattern at the top of this page: inputs at record highs, with AI in 87% of sales orgs, while AE quota attainment slid from 51% to 48%. A benchmark sheet tells you where you stand against those figures. A shopping list adds another shelf. Neither one tells you whether your own process ran.
The order matters most with AI. I put it this way to a RevOps manager whose sales team wanted an AI data-entry tool:
From the field
It’s almost an audit. You’re gonna put your sales process in. It’s controlling it. It’s change management. Then the question is, okay, where do I wanna leverage AI? That’s the question after I have the full audit, after everybody’s very solid.
Start by finding your own gap number. For the foundations, what is sales enablement is the place to begin.
Supered was built for this job: the Behavior Layer surfaces your process in the flow of the work inside HubSpot and Salesforce and measures whether reps follow it, so the inspection happens without a manager chasing it.
How to cite these statistics
Cite the original source named beside each number, with its year, and link to that source. For Supered’s own findings, use: The State of Sales Enablement 2026, Supered, survey of 198 sales leaders, January to March 2026, supered.io/state-of-sales-enablement. If this page helped you find a figure, a link back to it is appreciated. Figures marked “prediction” are Gartner forecasts about the future, and figures marked “older study” predate 2024; cite both with that label attached.
Frequently asked questions
What percentage of companies have a sales enablement function?+
What is the most important sales enablement statistic for 2026?+
Does sales enablement improve win rates?+
How long does it take a new sales rep to ramp in 2026?+
How many companies use AI in sales enablement?+
How should I cite these sales enablement statistics?+
Your process, running itself.