Sales Process Optimization: Measure Adherence Before You Tune
The standard optimization playbook assumes reps run the process you are tuning.
With 89% of processes defined and 36% followed, that assumption fails first. The sequence that works, with the math.
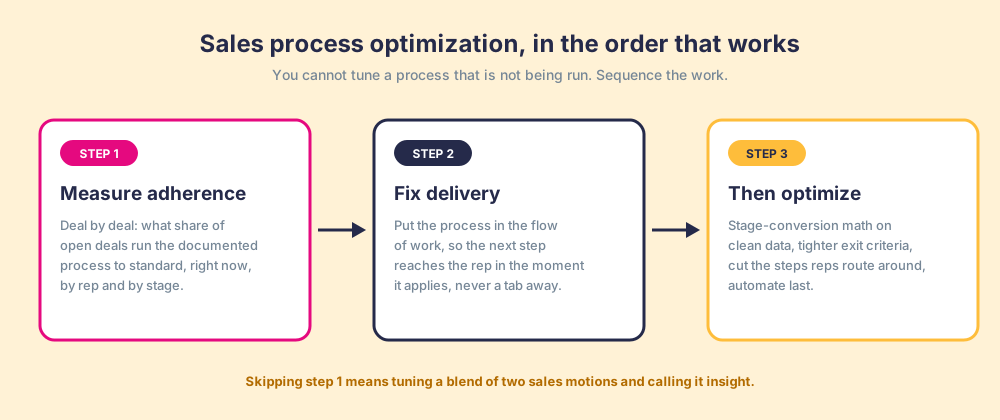
Sales process optimization is the practice of making an existing sales process perform better, in the order that works: measure adherence deal by deal, fix delivery so the process runs in the flow of work, then tune stages and exit criteria with clean data.
The quarter comes in under plan, so the RevOps lead pulls the funnel report. Demo-to-proposal conversion looks soft, and the fix seems obvious: redesign the demo stage, rework the deck, add an automation that books the follow-up before the call ends. Careful work, weeks of it. And it changes nothing, because half the team never ran the demo checklist in the first place.
Sales process optimization is the practice of making an existing sales process perform better, and it only works in one order: measure adherence deal by deal, fix delivery so the process runs in the flow of work, then tune stages and exit criteria with clean data. The order is the argument. The field’s standard advice skips the first two steps, and the data says those are the steps where the money is.
Two numbers from The State of Sales Enablement frame the problem. 89 percent of sales leaders say they have a defined sales process. 36 percent say reps follow it as designed. That is a 53-point gap between the process on paper and the process in the field. An optimization project launched without checking which side of that gap the team sits on is tuning blind.
Why does most sales process optimization advice fail?
Survey the advice on how to optimize a sales process and it converges on one playbook. map the funnel, measure conversion by stage, find the friction, remove low-value steps, automate the handoffs. None of it is wrong. The foundational case for the whole genre is Jason Jordan and Robert Kelly’s research in Harvard Business Review, which found that companies with a formal sales process grew revenue 18 percent faster than companies without one. The finding holds up a decade later, and we cite it ourselves.
Read Jordan and Kelly closely, though, and the result carries a condition the optimization posts drop. The lift came from having a formal process and managing to it: the same research found that companies whose managers spent at least three hours per month managing each rep’s pipeline saw 11 percent greater revenue growth than those spending less. The lift belongs to the process being run and inspected. The standard optimization playbook borrows the conclusion and forgets the condition, and with adherence at 36 percent, the condition fails before the first funnel review.
A mechanic can spend a satisfying afternoon on an engine: adjust the timing, rebalance the fuel mix, chase a cleaner burn. All of that work assumes the engine turns over. If it does not, the tune-up is careful, skilled, and unmeasurable, because the tuned engine was never the engine producing the numbers. You do not reach for the timing light first. You reach for the key.
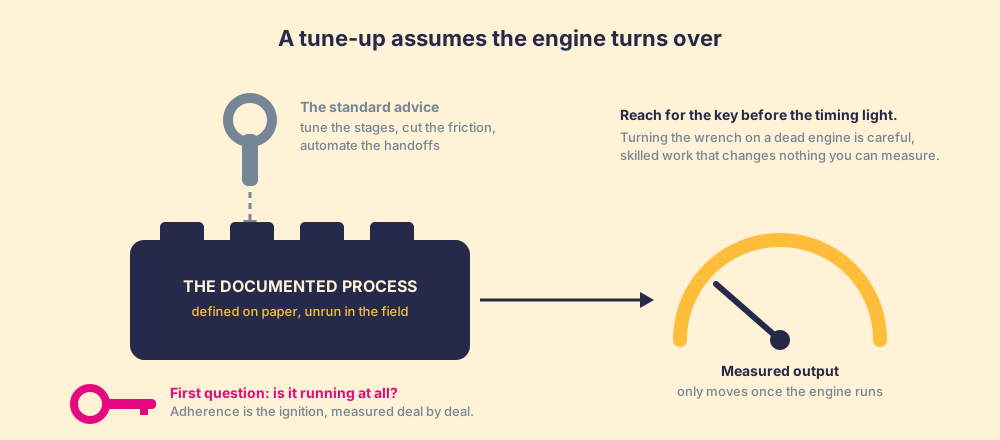
An unrun sales process is a stalled engine. Optimizing it produces the same afternoon: real effort, plausible changes, and an output gauge that never moves, because the tuned process was never the process producing the pipeline.
How do you measure adherence before you optimize?
Adherence is a percentage you can compute this week. Pick the three to five checkable steps that define your process: the required discovery fields, the exit criteria at each stage, the recorded next step. Then count the share of open deals that meet them right now, by rep and by stage. That number, deal by deal instead of self-reported in a survey, is your adherence rate, and the full method lives in our post on sales process adoption.
Sales rep adherence is the same arithmetic cut by owner, and it is where the number becomes coachable. Take three checks: the decision process recorded before a deal enters Propose, the economic buyer added before a proposal goes out, and a dated next step on every open deal. A rep whose 20 open deals include 12 that pass all three scores 60 percent. Run it weekly and break it down by step as well as by rep, because the two cuts answer different questions. A step that fails across the whole team is a design problem, which the desire-path section below deals with. A step that fails for one rep is a coaching conversation for this week, and the scorecard tells the manager which conversation to have.
| Rep | Open deals | Pass all three checks | Adherence | Weakest step |
|---|---|---|---|---|
| Rep A | 20 | 12 | 60% | Economic buyer before proposal |
| Rep B | 15 | 13 | 87% | None below 90% |
| Rep C | 18 | 6 | 33% | Decision process recorded |
| Team | 53 | 31 | 58% | Economic buyer before proposal |
The reps and counts are illustrative. The shape is the point you can steal: one row per rep, one number, and the step that drags it down.
The reason to compute it first is that there is a threshold below which optimization gains do not register. Tamara Schenk’s team at CSO Insights studied thousands of sales organizations and found that those with a dynamic sales process and adoption above 75 percent improved win rates by 12 percent and quota attainment by 16 percent compared to those without (CSO Insights, 2018). Below that waterline, the same process produced no comparable lift. The process did not get worse. It was run on too few deals to move the aggregate.
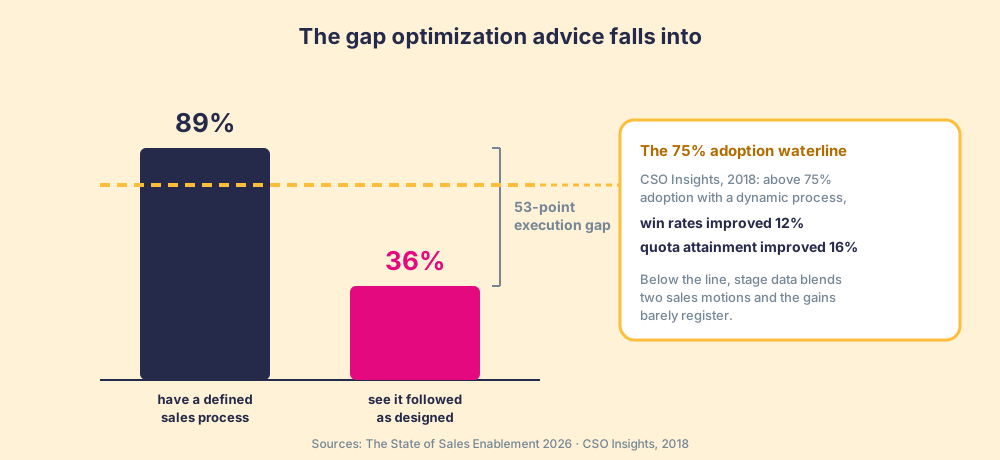
The waterline has a second consequence: below it, your funnel report stops meaning what you think it means. Stage conversion at 36 percent adherence averages two different sales motions (the documented one and whatever each rep runs instead) into one number. Any change you evaluate against that number is being graded against noise. Clean data is a product of adherence, and it arrives before insight does.
What software measures sales process adherence?
Five kinds of software touch sales process adherence, and each one sees a different slice of rep behavior. Before you buy, decide which behavior you need to see: what reps say on calls, which clicks they make inside an app, or whether each open deal meets the stage it sits in.
- CRM required fields and validation rules. Built into HubSpot and Salesforce, and free. They enforce a field at the moment a rep saves a stage change, which makes them the right tool for a hard gate. They cannot judge whether the field holds anything true, and a gate that blocks the save is how reps learn to type “TBD” into it.
- CRM reports and dashboards. Also built in. They can show adherence across the pipeline, but only when someone builds the report and reads it, so drift surfaces at the pipeline review rather than the week it starts.
- Conversation intelligence. Gong is the category leader; Clari, which merged with Salesloft in a deal that closed in December 2025, sits next to it. These tools score what happens on recorded calls, such as talk ratios, topics covered, and methodology moments. If your adherence problem lives inside the conversation, this is the better instrument. They do not check whether the CRM stage criteria were met between calls.
- Digital adoption platforms. WalkMe (owned by SAP since September 2024) and its peers guide users click by click inside web apps and measure feature usage. They answer “did reps use the screen?” more than “did the deal meet the exit criteria?”
- A process-adherence layer. Supered checks open deals against your stage rules continuously, shows each rep the next step inside the CRM and the tools they already work in, and rolls the result up by rep, stage, and rule. It is built for the deal-by-deal question in this sequence, and it is not a call recorder.
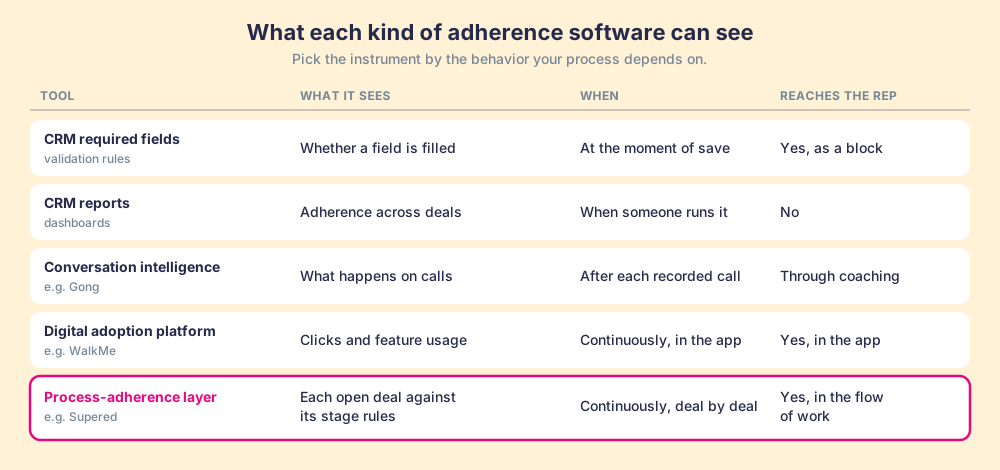
Many teams end up running two: conversation intelligence for the calls, and a deal-level adherence check for the process between them. The mistake is buying the call tool and assuming it measures the stage criteria, or building a dashboard and assuming someone reads it the week the drift begins.
How do you get the process running before you tune it?
Reps skip a process for structural reasons, and delivery is the biggest one. When the playbook lives in a doc and the deal lives in the CRM, following the process costs a detour at the exact moment the rep has the least room for one. That is a system failure, and it has a system fix: put the step in front of the rep in the moment it applies, in the tools where the work is happening.
The State of Sales Enablement puts a hard number on the delivery effect. Teams whose process reaches reps in the flow of work hit quota at 49 percent. Teams whose process lives in a doc, wiki, or LMS hit quota at 15 percent. Same intent, same playbooks, and a 34-point attainment difference decided by when the process shows up. Delivery is the biggest single fix on this list, and the standard optimization playbook leaves it out, because that playbook assumes the process is already arriving.
This step is also where optimization work shades into change management. If what you are shipping is bigger than a tune (a new methodology, a restructured pipeline), the two-week rollout playbook for landing that change in rep behavior is on our sales process optimization use case page. This post covers the method; that page covers the outcome and what it looks like running.
What should you optimize once the process is running?
With adherence measured and delivery fixed, the classic sales process improvement toolkit finally works, because the data underneath it describes one motion. Four moves, in rough order of return:
- Stage-conversion math. Compute conversion and time-in-stage on adherent deals. Weak stages are now visible instead of blended away, and a fix can be evaluated against a stable baseline.
- Exit-criteria tightening. Replace activity-based gates with buyer-position gates, so a stage records where the buyer stands and what the rep verified, and a deal advances on evidence. The foundations are in what a sales process is.
- Desire paths. Find the steps the team routes around, and treat the routing as evidence about the step. Fix it or cut it.
- Automation, last. Automate and add AI only after the motion is adopted and measured, because automation multiplies whatever process sits under it, working or broken.
Groundskeepers meet the desire path every year. Pave a sidewalk at a right angle, and by spring a dirt line runs diagonally across the grass. No committee voted to defect from the sidewalk. Hundreds of people each made one reasonable decision, and the lawn recorded the vote. A process step that most of your team skips, once delivery is fixed and adherence is measured, is the same worn line: it tells you the step costs the rep more than it visibly returns. The productive response is to fix the step so it pays for itself, or cut it and pave the path the team already walks. Re-posting the sign changes nothing, and blaming the walkers misses that the system drew the path.
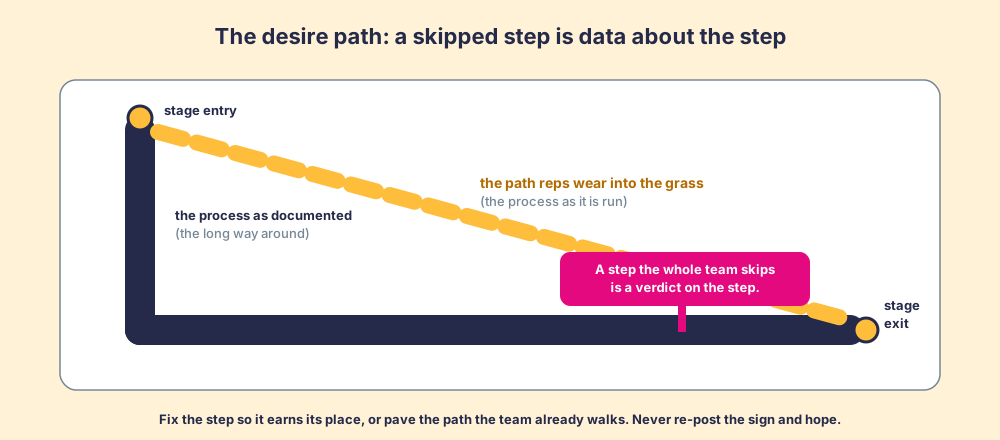
One distinction keeps this signal from being over-applied: a step the whole team skips is data about the step, and a step one or two reps skip is a coaching conversation. The desire path is a population-level pattern. Read it at the population level.
A worked example, with the math
The numbers below are an illustration built on round numbers to show the mechanics. They are not survey data, and your pipeline will differ.
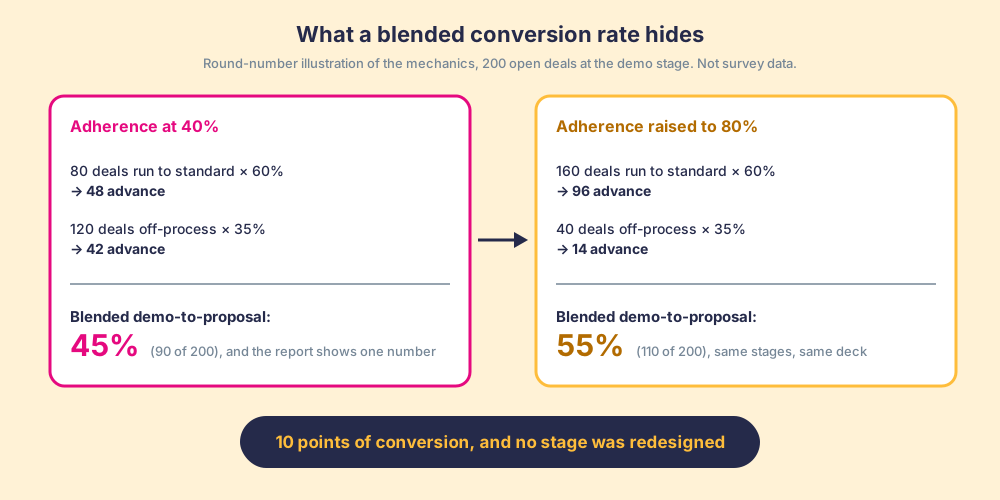
Say 200 deals sit at the demo stage this quarter, and blended demo-to-proposal conversion reads 45 percent. Adherence, once you measure it, is 40 percent. Split the funnel and the single number comes apart: the 80 deals run to standard convert at 60 percent (48 advance), while the 120 off-process deals convert at 35 percent (42 advance). Together that is 90 of 200, the 45 percent your report shows. The report was averaging two sales motions, and the redesign-the-demo-stage project would have tuned the wrong one.
| Scenario | On-process deals | Off-process deals | Blended conversion |
|---|---|---|---|
| Adherence at 40% | 80 × 60% → 48 advance | 120 × 35% → 42 advance | 90 of 200 = 45% |
| Adherence at 80% | 160 × 60% → 96 advance | 40 × 35% → 14 advance | 110 of 200 = 55% |
Now raise adherence from 40 percent to 80 percent and change nothing else. 160 deals convert at 60 percent (96 advance), 40 convert at 35 percent (14 advance), and blended conversion reads 55 percent: 110 of 200. 10 points of stage conversion, with the same stages, the same deck, and the same reps. And at 80 percent adherence, the on-process motion is finally visible on its own, which is the moment tuning its 60 percent becomes a real project with readable results.
The sequence has one expensive step, and it is the first one. Auditing adherence deal by deal is manual work, and a quarterly audit catches drift a quarter late. Supered was built for that job. The Business Logic Layer measures adherence deal by deal across the open pipeline and delivers the process in the flow of work, inside HubSpot, Salesforce, and the tools reps already use, so steps one and two of the sequence run continuously instead of as a project.
What we recommend
Three ways forward exist, and teams run all three. The first is the standard playbook: optimize on top of blended data and hope the changes land. The 89-versus-36 gap is the measure of how often that bet is placed on a process that is not running. The second is enforcement-first: make the fields required everywhere and call the resulting compliance adoption. It produces reps who fill boxes to pass a gate, and data that looks clean while describing nothing. The third is the adherence-first sequence, and it is what we recommend:
- Adherence, measured first. Deal by deal, against three to five checkable steps, before any redesign is scoped. The 89-versus-36 gap says the odds are your process is less run than you think.
- Delivery, fixed second. The process reaches the rep in the moment of the work. The 49-versus-15 quota split is the size of that lever.
- Optimization, run third. Stage math on clean data, exit criteria on buyer position, desire-path steps fixed or cut, automation sequenced last. The CSO Insights waterline (75 percent adoption, then 12 percent win-rate and 16 percent quota gains) is the payoff line you are optimizing above.
If you set out to optimize sales process performance this quarter, the first deliverable is your adherence number, not a redesigned stage. If you are still building the process rather than tuning it, start with the full guide to the sales process and come back when it is written. If the process exists and the blended report above looked familiar, book a demo and we will show you your adherence number, on your pipeline, before anyone touches a stage.
Frequently asked questions
What is sales process optimization?+
What is the first step in optimizing a sales process?+
How do you measure sales rep adherence?+
What software measures sales process adherence?+
How do you know which sales process steps to cut?+
When should you automate parts of the sales process?+
Can you optimize a sales process reps do not follow?+
Your process, running itself.